
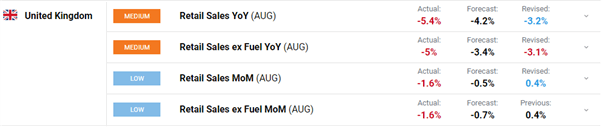
UK retail sales figures released early in the session underscored a high street in trouble. Retail sales volumes fell by 1.6% in August, continuing a downward trend since the summer of 2021 according to the Office for National Statistics. The ONS wrote ‘All main sectors (food stores, non-food stores, non-store retailing and fuel) fell over the month, this last happened in July 2021, when all legal restrictions on hospitality were lifted’. Worryingly, retail sales volumes fell by 5.1% in the three months to August 2022, while sales values rose by 5.6%, ‘reflecting an annual implied deflator (or implied growth in prices) of 10.7%’. Sterling fell sharply post-release with cable hitting a nearly four-decade low of 1.1350.
As noted in the story above, the Bank of England (BoE) meets this Thursday to announce its latest monetary policy decision, with a 50 basis point rate already fully baked-in. The UK central bank is in an awkward situation as they announce their decision one day before an emergency mini-budget is delivered by chancellor Kwasi Kwarteng. UK inflation (9.9%), once mooted to hit 20%+ according to some investment banks, will fall sharply if the UK government lives up to its promise of capping consumer energy costs for the next two years. The BoE may rein in any thoughts of a 75 basis point rate hike if they believe/know that the chancellor will effectively cool price pressures the next day. This may leave GBP/USD vulnerable to a further sell-off, especially if the US Federal Reserve hikes by a minimum of 75 basis points on Wednesday.
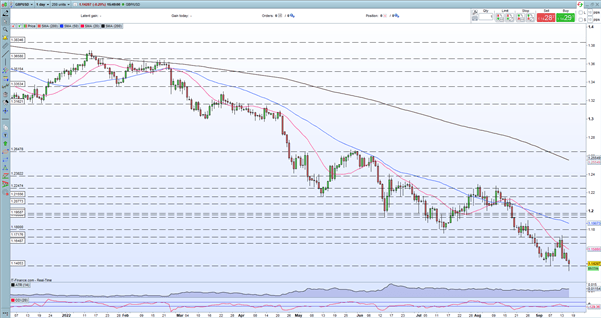
Looking at GBP/USD and clear support is difficult to identify, especially after hitting levels last seen in 1985. The chart setup remains negative and while a short-term recovery bounce cannot be ruled out, cable looks set to move lower.
GBP/USD Daily Price Chart
(Click on image to enlarge)
Retail trader data show 82.47% of traders are net-long with the ratio of traders long to short at 4.70 to 1. The number of traders net-long is 8.29% higher than yesterday and 10.21% higher than last week, while the number of traders net-short is 20.58% lower than yesterday and 27.32% lower than last week.
We typically take a contrarian view to crowd sentiment, and the fact traders are net-long suggests GBP/USD prices may continue to fall. Traders are further net-long than yesterday and last week, and the combination of current sentiment and recent changes gives us a stronger GBP/USD-bearish contrarian trading bias.
What is your view on the British Pound – bullish or bearish?
More By This Author:
Euro Forecast – Punchy Fed Rate Hike Will Force EUR/USD Ever Lower
US Dollar (DXY) On The Back Foot, Bruised By The ECB And BoJ
Japanese Yen (JPY) Collapses Across The Board As The BoJ Ramps Up Bond Purchases


Comments
Log in or sign up to join the conversation.