
Monthly indicators followed by the NBER Business Cycle Dating Committee, plus GDP and GDO,plus IHS-Markit (nee Macroeconomic Advisers) monthly GDP:
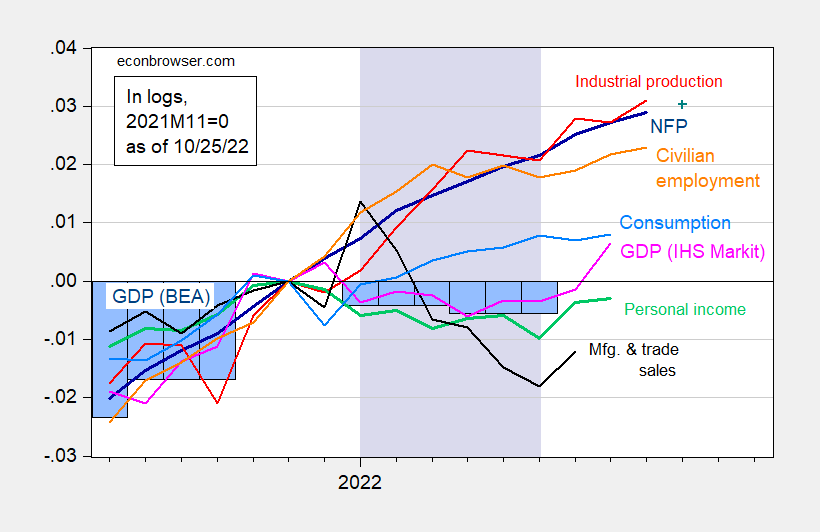
Figure 1: Nonfarm payroll employment (dark blue), Bloomberg consensus as of 10/25 for NFP (blue +), civilian employment (orange), industrial production (red), personal income excluding transfers in Ch.2012$ (green), manufacturing and trade sales in Ch.2012$ (black), consumption in Ch.2012$ (light blue), and monthly GDP in Ch.2012$ (pink), official GDP (blue bars), all log normalized to 2021M11=0. Lilac shading denotes dates associated with a hypothetical recession in H1. Source: BLS, Federal Reserve, BEA, via FRED, IHS Markit (nee Macroeconomic Advisers) (10/4/2022 release), and author’s calculations.
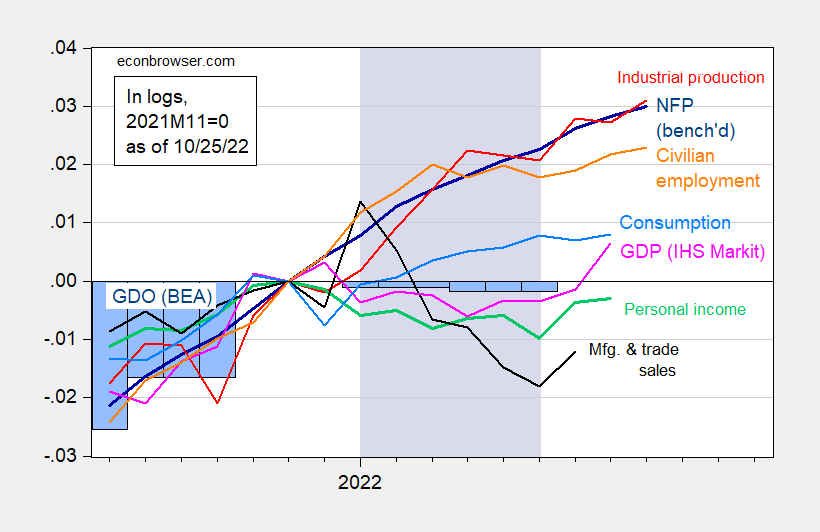
Figure 2: Nonfarm payroll employment as implied by preliminary benchmark revision (dark blue), civilian employment (orange), industrial production (red), personal income excluding transfers in Ch.2012$ (green), manufacturing and trade sales in Ch.2012$ (black), consumption in Ch.2012$ (light blue), and monthly GDP in Ch.2012$ (pink), official GDO (blue bars), all log normalized to 2021M11=0. Lilac shading denotes dates associated with a hypothetical recession in H1. Source: BLS, Federal Reserve, BEA, via FRED, IHS Markit (nee Macroeconomic Advisers) (10/4/2022 release), and author’s calculations.
It’s of interest to recall what prompted the claims of recession for H1 2022. For some, it was the negative read on GDP. For others, it was vehicle miles traveled, or oil consumption (both from Steven Kopits). Here’s the evolution of these two indicators (which I think of contemporaneous or lagging), and heavy truck sales (suggested by Calculated Risk).
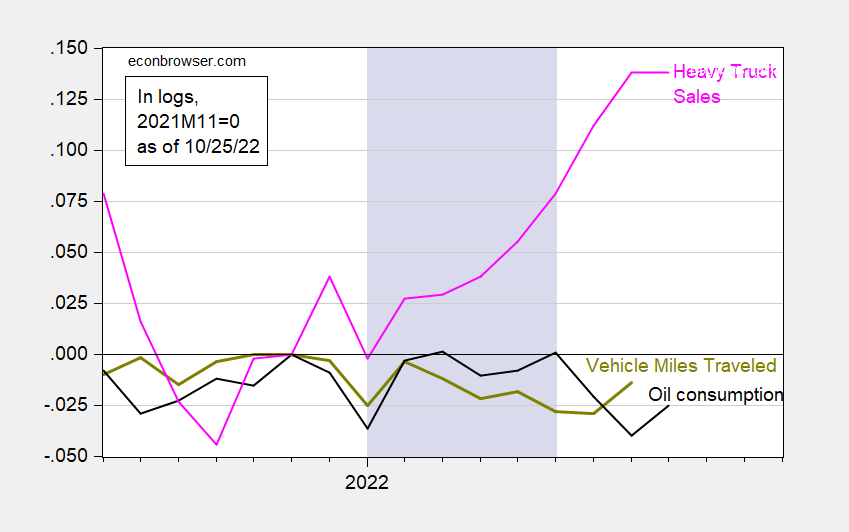
Figure 3: Vehicle miles traveled, seasonally adjusted (chartreuse), oil consumption in millions barrels per day (black), and heavy truck sales millions of units at annual rate (pink), all log normalized to 2021M11=0. Lilac shading denotes dates associated with a hypothetical recession in H1. Source: BTS, EIA, BEA via FRED, and author’s calculations.
As I showed in this post, vehicle miles traveled, regardless of transformation, is a pretty lousy indicator, and certainly outperformed by heavy truck sales. Hence, the flat trajectory for VMT and oil consumption seem interesting, but not dispositive for me. The rise in heavy truck sales does seem to counter the argument of a recession in H1.
What about the GDP series? First, note that NBER BCDC does not place primary weight on GDP. Second, GDO exhibits much shallower drop than GDP. Third, GDP will continue to be revised over time; hence, the contours of GDP may look quite different in a couple of years, much like what happened with the recession of 2001 (which in the end did not conform to the “two-consecutive quarter” rule of thumb).
Looking forward, Bloomberg consensus as of today is 2.4%, GDPNow is at 2.9% (10/19), St. Louis Fed “news” index is 1.3% (10/21).
More By This Author:
How Is That Trap Working Out?How Do You Know Where You’re Going If You Don’t Know Where You Are? (China Statistics Edition)
Evaluating “Recession Fears”


Comments
Log in or sign up to join the conversation.