Turnaround Tuesday
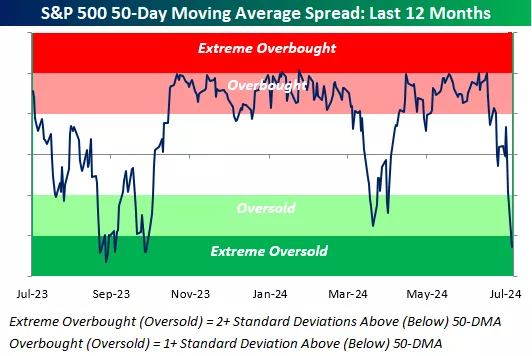
After three straight days of 1%+ drops, the S&P 500 finally hit extreme oversold territory yesterday by moving more than two standard deviations below its 50-day moving average. Below is a chart that's included in our Morning Lineup every day to help investors gauge overbought/oversold levels. It's a helpful way to get a quick check-up on the market.

In addition to the chart above, we also featured the chart below in today's Morning Lineup. Here's the text that was included:
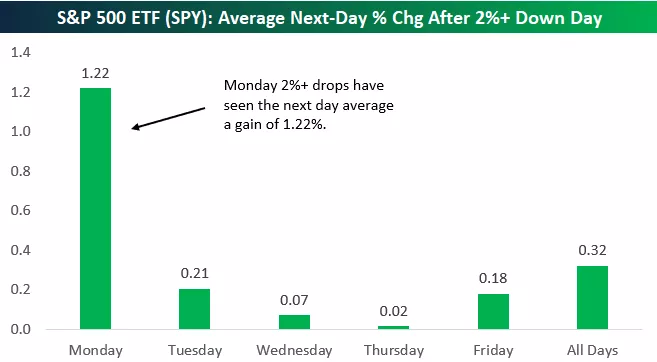
Yesterday was the 330th time that the S&P 500 ETF (SPY) has seen a one-day drop of more than 2% (since it began trading in 1993). It was also the 61st time we've seen a 2%+ decline on a Monday. Below is a look at the average next-day percentage change seen for SPY after 2%+ drops by weekday. As shown, Monday drops of 2%+ have by far seen the biggest bounce back on the following day, with an average next-day gain of 1.22%. As we've said in the past, there's a reason the term "Turnaround Tuesday" exists.

More By This Author:
Defense OutperformsTreasury Rally Enters Its Fourth Month
Historic Readings From The Dallas Fed
Sign up for Bespoke Premium with our Dog Days ...
more


