
Turnaround Tuesday?
The S&P 500 Index closed down 1.59% on Monday and the Dow Jones Industrial Index was down 2.09%. At the low, and late in the trading session, the S&P 500 Index was down over 2%. A multitude of factors was cited for the pullback, but the fact the market has had a nearly uninterrupted move higher since the pandemic contraction should be at the top of one's list. Just this year the S&P 500 Index is up 13.4% and is up 32.1% over the last 12 months on a price-only basis. With the market decline on Monday, some are now focused on a "turnaround Tuesday" possibility. History does suggest the equity market has a tendency to recover the day following significant market declines.
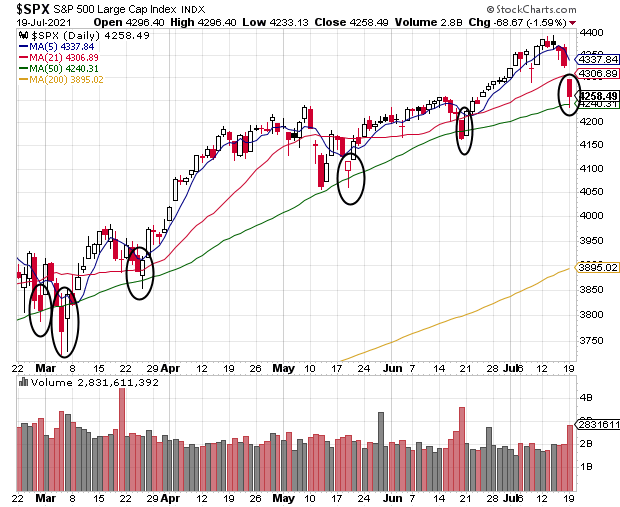
The S&P 500 Index has a tendency to find support at its 50-day moving average as seen in the below chart. I wrote a post a month ago, Does Fed's Hawkish Posture Create A 'Buy The Dip' Moment?, following the Fed's hawkish comments and the market pullback that occurred then and reached its 50- day moving average. I recovery occurred subsequent to that pullback.
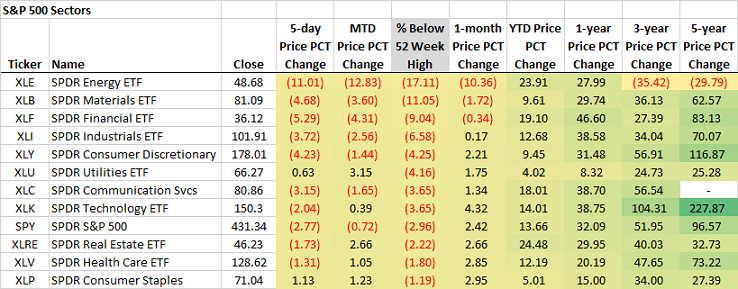
One factor for investors to keep in mind is the market continues to trade near its 52-week high. With today's pullback, the S&P 500 Index is only down about 3% from its high, not much of a pullback. The below table does show areas of the market that have experienced more significant drawdowns, specifically, energy down 17.1% from its high, but still up 28% over the last 12-months. The economically sensitive sectors have experienced the brunt of this pullback so far.
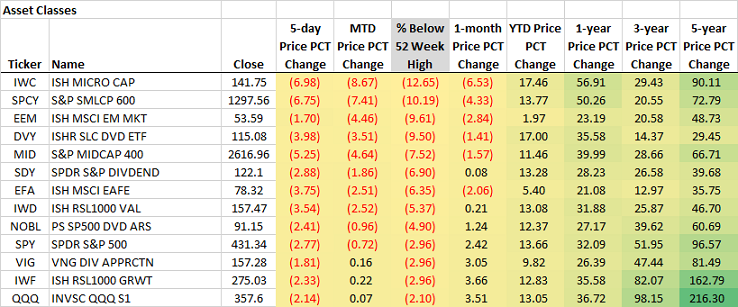
From an asset class perspective areas that have been outperformers this year have declined the most, i.e., micro cap and small cap stocks are down double digits from their 52-week highs, yet remain up over 50% on a 12-month basis.
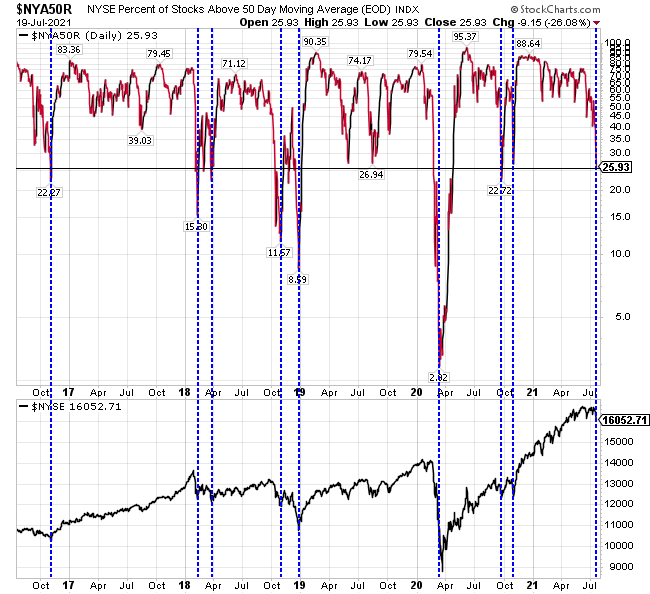
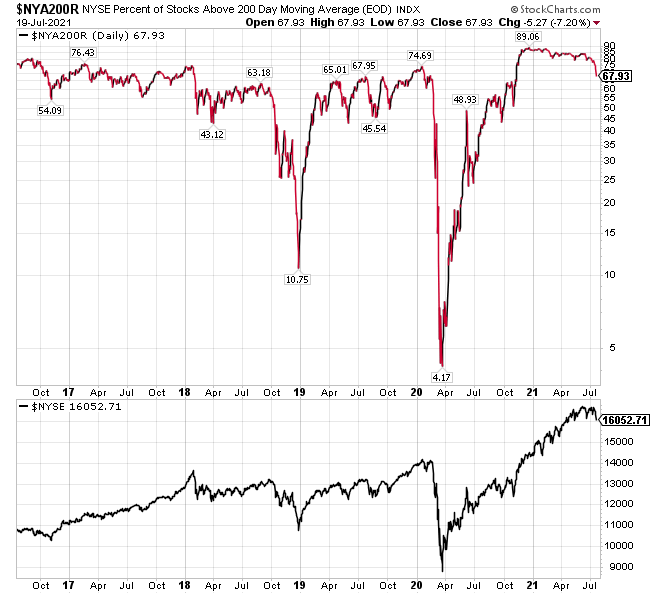
Lastly, when reviewing the percentage of NYSE stocks trading above their 50 and 200 day moving averages, the 50 day moving average data suggests stocks are short-term oversold as seen in the first chart below. Only 25% of stocks are trading above their 50 day moving average as of Monday's close. In the second chart, 67% of NYSE stocks continue to trade above their 200 day moving average. The longer average tends to remain at a higher level unless a significant market event occurs as in 2019 and the February/March 2020 periods.
We continue to believe economic strength is supportive of a stronger business environment that translates to respectable equity market returns. Broadly, equity valuations are elevated, yet interest rates are extremely low and this supports higher valuations. A market pullback would be healthy and provide investors with an opportunity to selectively adjust their asset allocation if desired.
Disclaimer: The information and content should not be construed as a recommendation to invest or trade in any type of security. Neither the information nor any opinion expressed constitutes a ...
more

