
Relying on GDP might provide a misleading impression of regained momentum.
(Click on image to enlarge)
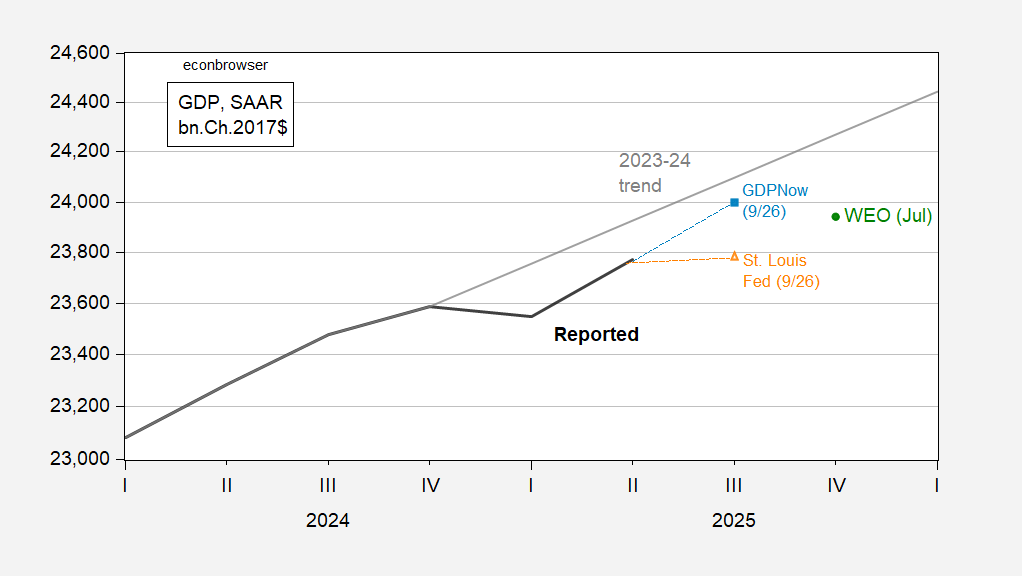
Figure 1: GDP (bold black), 2023-24 stochastic trend (gray), GDPNow (9/26) (light blue square), St. Louis nowcast (9/26) (orange triangle), IMF WEO (July) (green circle). Source: Atlanta Fed, St. Louis Fed, IMF World Economic Outlook, July update, author’s calculations.
One might be tempted to see a return to the pre-Trump GDP trajectory (especially if one relies on the Atlanta Fed’s nowcast), but it’s not clear to methis path is sustainable, especially when we consider aggregate demand’s evolution, as measured by final sales to private domestic purchasers, what Jason Furman refers to as “Core GDP”. I think that particularly in these times, focusing on this measure is advisable, given the measurement issues attendant with imports and inventories in the front-running of tariffs.
(Click on image to enlarge)
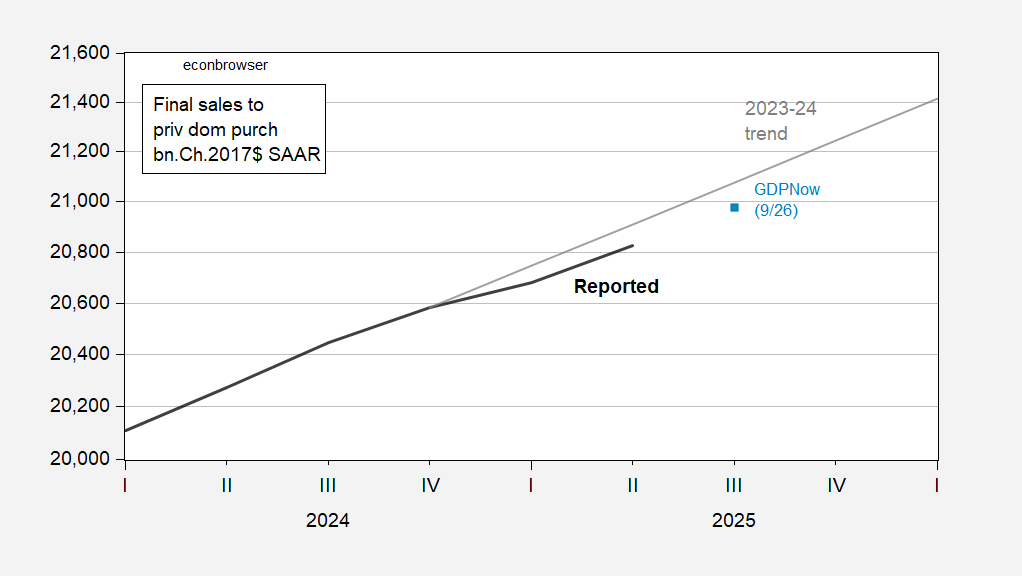
Figure 2: Final sales to private domestic purchasers (bold black), GDPNow nowcast of 9/26 (light blue square), 2023-24 stochastic trend (gray), all in bn.Ch.2017$ SAAR. Source: BEA, Atlanta Fed, author’s calculations.
As this graph demonstrates, even with the fairly upbeat Atlanta Fed nowcast, private domestic aggregate demand has not returned to its pre-shock trajectory.
More By This Author:
What Exactly Happened To The Dollar Around “Liberation Day”: Illiquidity Vs. No-ConfidenceGrowth Reliance On The Tech Spending Boom
Sentiment Declines


Comments
Log in or sign up to join the conversation.