
True Fund Costs: Consumer Discretionary Sector
This report focuses on providing investors the true costs incurred when investing in Consumer Discretionary ETFs and mutual funds. A key component of our fund ratings, Total Annual Cost (TAC) accounts for all the costs born by investors, including transaction costs and many other fees. Expense ratios often drastically understate the total cost of a fund.
Figure 1 shows ETFs and mutual funds in the Consumer Discretionary sector whose expense ratios understate their TAC by the most.
Figure 1: Funds With Most Misleading Expense Ratios
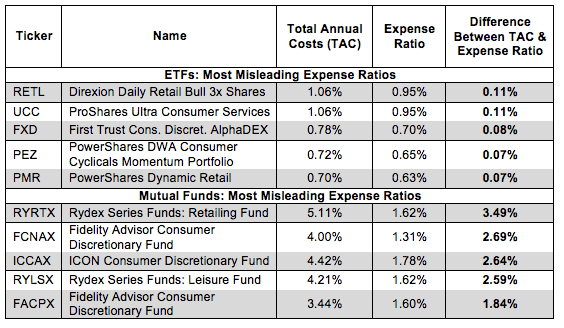
Source: New Constructs, LLC and company filings
Direxion Daily Retail Bull 3x Shares (RETL) has the greatest disparity between TAC and expense ratio amongst ETFs. While the difference seems small now, over time that difference adds up. More importantly, you deserve to know your true costs. Rydex Series Funds: Retailing Fund (RYRTX) has the most misleading expense ratio amongst mutual funds in the sector as it is 3.49% lower than its actual total annual costs. 3.49% is a large difference. Over just ten years, 3.49% compounds to 41%. I think most investors would like to know about such a large additional cost before they put money into RYRTX.
A key takeaway for fund investors here is that they should focus on the Total Annual Cost of funds, not just the expense ratio because it can be misleading.
The average TAC for ETFs in this sector is 0.52% and for mutual funds it is 2.71% We recommend investors focus on funds with TACs that are below these averages. See our free mutual fund screener to get the TAC on 7200+ ETFs and mutual funds. I strongly recommend that investors avoid funds that charge far above-average TACs as it will be extremely difficult for them to earn returns above a less-expensive benchmark consistently.
Figure 2 shows the number of ETFs and mutual funds with TACs above the average and below.
Figure 2: Number of Funds that With Above and Below Average Total Annual Costs (TACs)
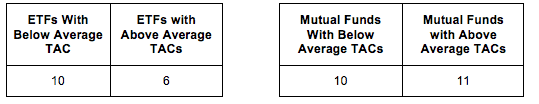
Source: New Constructs, LLC and company filings
We provide predictive fund ratings for 7200+ ETFs and mutual funds according to the quality of their holdings (Portfolio Management Rating), their costs (Total Annual Costs Rating), and the fund’s rank relative to every other ETF and mutual fund.
Our Best & Worst ETFs and Mutual Funds for the Consumer Discretionary Sector report reveals our predictive ratings on the best and worst funds in the sector.
Disclosure: NewConstructs staff receive no compensation to write about any specific stock, sector, or theme.


