
Wall Street had a mixed day on Wednesday, first rising till noon and then turning lower to close the day in the red. EV maker Rivian (RIVN) fell 15%, its first fall since its IPO debut last week, with other EV stocks down as well.

The S&P 500 closed at 4,689, down 12 points, the Dow Jones Industrial Average closed down 211 points or 0.58%, at 35,931, while the Nasdaq Composite closed at 15,922, down 52 points. Currently future trading for all 3 indices is green, S&P futures are up 8 points, Dow futures are up 18 points and Nasdaq 100 futures are up 51 points.
Top Losers in Wednesday's trading were to be found among energy, financial and retail issues. The Gap (GPS) and Target (TGT) both fell markedly.
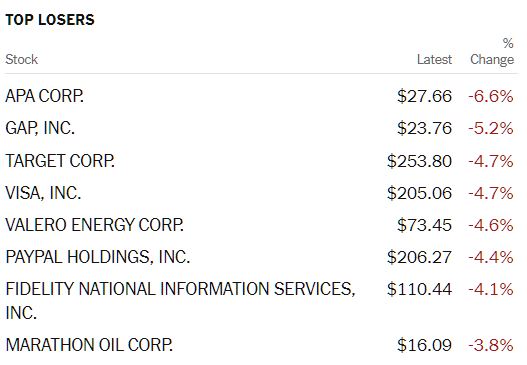
Chart: The New York Times
TalkMarkets contributor Jesse Felder writing in The Fasten Seat Belt Sign Just Lit Up notes that the Nasdaq Composite has hit its 13th and 14th Hindenburg omens of the year and suggests we brace for some coming turbulence. Both an educational and entertaining read, as well as another way to evaluate the action. Below is some of what he has to say:
"A few months ago, I drew attention to the fact that the Nasdaq was showing signs of increasing dispersion under the surface, a warning regarding the relative health of the uptrend. The following month, the Nasdaq Composite underwent a brief correction of about 8% (from high to low)...I am referring to a signal called the Hindenburg Omen that is triggered when the index sits at or near a new high and both the number of new 52-week highs and lows on the exchange rises above a certain threshold (here are the details).
I find that tracking the number of signals over certain time periods has a great deal of value at forecasting increasing volatility. The history of the Nasdaq Composite over the past couple of decades is a good example of this. This week saw the index trigger its 13th and 14th Hindenburg Omens of the year. In the past, this degree of persistent dispersion has been a consistent precursor to corrections or bear markets in the index."
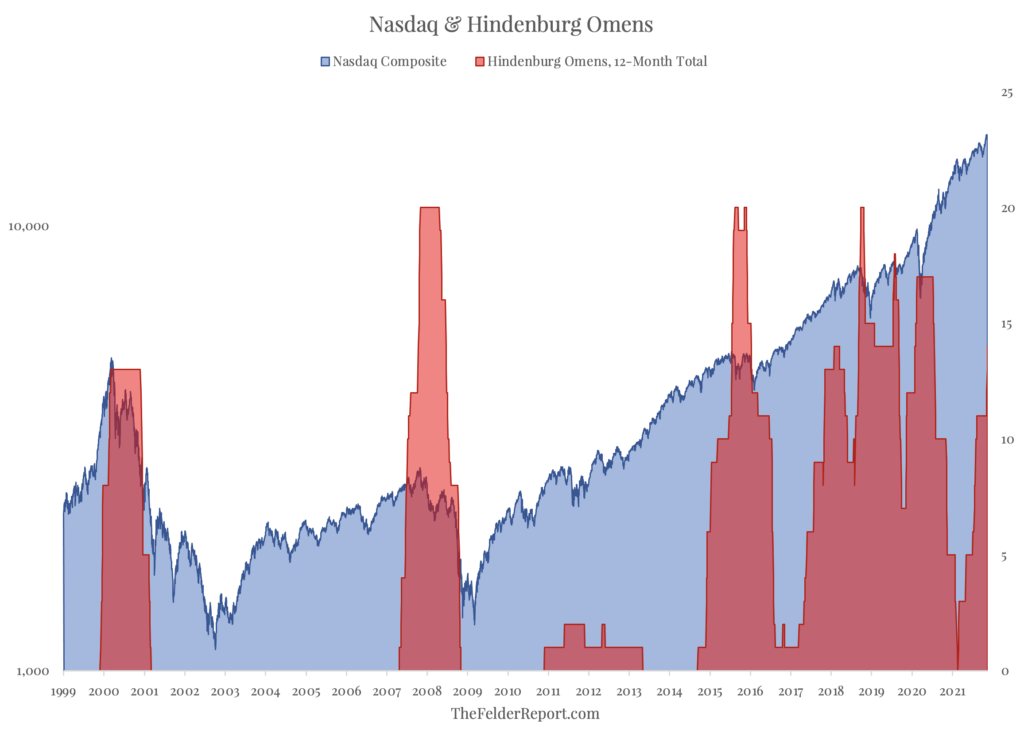
In the below table Felder illustrates historical changes in Nasdaq Composite returns following a consecutive 13th Hindenburg omen.
"In March of 2000, at the peak of the DotCom mania, we saw the index trigger its 13th omen and a bear market ensued shortly thereafter, as did another in 2007-2008, after 13 omens were triggered in October of 2007. It wasn’t until almost eight years later the running total hit 13 again, just prior to a pair of corrections in mid-2015 and early-2016. Then, in late-2017, we saw 13 omens eclipsed again heading into the “Volmageddon” episode in early-2018. 13 proved the magic number once again later that year just prior to the fourth quarter selloff that bottomed around Christmas. Finally, we saw 13 omens triggered again just prior to the COVID crash in early-2020."
| Date | 3M Return | 6M Return | 12M Return |
| 3/7/00 | -21% | -15% | -54% |
| 10/12/07 | -12% | -19% | -34% |
| 7/20/15 | -6% | -14% | -2% |
| 11/7/17 | 4% | 7% | 12% |
| 9/6/18 | -9% | -5% | 2% |
| 1/29/20 | -4% | 14% | 41% |
| Average | -8% | -5% | -6% |
Felder's concluding take: "...it would appear that when dispersion within the stock market reaches a certain level it is a pretty good warning sign of turbulence just ahead."
Continuing this cautionary theme contributor Tracey Ryniec of Zack's Investment Research asks Are Stocks In A Bubble?
"With the S&P 500 hitting new highs nearly every day this fall, are stocks in a bubble?...Older stock investors have vivid memories of the dot-com bubble...(The Dot.com Bubble)...came at the end of an 18-year bull market in stocks which lasted from 1982 to 2000...By the late 1990s, the “tech titans” of Microsoft, Cisco, Intel, and Dell were must-owns.
Microsoft (MSFT) and Cisco (CSCO) weren’t dot-coms that made no money. These companies were blue chips that made billions.
Investors poured money into their shares.
From Jan 2, 1998, to Jan 3, 2000, Microsoft shares jumped 240%.
During that same time, Cisco, which was one of the hottest stocks of the decade gaining over 10,000%, was up another 447%...Qualcomm (QCOM) was a day-trader favorite. During those 2 years, QUALCOMM shares jumped 2216%."
Image: Bigstock
"The 2021 Bull Rally
In 2021, Microsoft is back in the game as one of the FANGMAN stocks. Over the last 2 years, Microsoft shares have gained 126.4%.
And other Silicon Valley darlings are again in the spotlight...Nvidia (NVDA) is one of the fan favorites. Over the last 2 years, Nvidia shares are up 486.8%.
Nvidia shares are trading with a forward P/E of 73.
But much like the late 1990s, who cares about P/Es? It’s all about the growth and innovation.
And nothing says “innovation” as much as Tesla (TSLA). Not only is it in a new, emerging industry of electric vehicles, Tesla is also on the cutting edge of AI-technology...Tesla shares are up 1,367% over the last 2 years.
Tesla isn’t cheap. It trades with a forward P/E of 169."
Thus begging the ever popular idiom "if it looks like duck... it is a duck", or in this case, if it looks like a bubble...is it a bubble?
Contributor Chris Vermeulen writes that we have just completed a "Hyper-Kondratieff Seasonal cycle" in a TalkMarkets Editor's Choice article titled What Market Trends Will Drive Through To 2022?.
"My opinion is that the globe pushed through a deep market contraction at the start of COVID-19. Following this was a strong global recovery phase – which happened within a 12-month window. After the November 2020 US Presidential Elections, while the extended COVID variants continued to plague the world, we entered a renewed type of Hyper-Kondratieff market cycle (Seasons)."

"Now that inflation is starting to rise, we may transition away from consumer and speculative market cycles. Over the next 6 to 12+ months, the markets may shift into a late-stage Bullish rally phase. My opinion is the COVID-19 virus, and economic event process has resulted in a speedy, possibly 24 to 36 month, extreme cycle phase."
"Follow my thinking through this process:
A. COVID became a known issue in late 2019. The Global markets are holding up reasonably well at that time. (Likely Moderate Spring/Summer in Kondratieff Seasons)
B. COVID HITS (Late February 2020). Lock-downs start and consumers shift their spending/saving habits. The mass transition begins for millions as the collapse of the global markets (a Hyper-Autumn/Winter/Spring Kondratieff cycle) takes place over only 4~5 months.
C. By July/August 2020, the global markets are starting to recover. Retail traders and institutions are eyeing the perceived recovery and believe the economic contraction is over. Retail traders begin to engage in the markets and start to drive trends (a post-COVID Spring and Early Summer event continues well into mid-2021).
D. The global markets, and many of the strongest ETFs and market indicators, peaked in February 2021 and entered an extended sideways/consolidation phase. That is, until recently. Inflation has started to become an issue. Global markets are struggling to find growth while the US markets continue to rally. (This is a late-stage Kondratieff Summer phase that is starting to transition into an early Kondratieff Autumn Season)"
"...I believe we’ve completed a Hyper-Kondratieff Seasonal cycle phase. We may now be heading into an extended Summer/Autumn cycle phase lasting well into early 2022 – possibly longer. Following this, the Winter Kondratieff season may be longer and more extensive in scope as price trends have become exaggerated over the past 24+ months.
My research suggests global market trends and ETF sectors are poised for a powerful rally through 2021 and into early 2022 as Q4:2021 earnings and the continued Kondratieff Summer season extends. Retail and Institutional Traders will chase this rally phase while global central banks ease away from making any sudden moves to disrupt this cycle."
"Traders need to stay prepared for any number of extreme price events over the next 12 to 24+ months, focusing on the strongest trending asset classes/sectors. If my research is correct, we should be transitioning into a late Summer Season – leading to an Autumn Season in early 2022. A Kondratieff Autumn season is indicative of a “Blow-Off Rally Phase” in the markets where a peak in price eventually sets up."
To paraphrase Joni Mitchell: "And the seasons they go 'round and 'round, And the "shiny stocks" go up and down Let's not be captives on the carousel of "memes and unicorns". To give Mitchell fair play you can hear her classic song here.

Image: YouTube
TalkMarkets contributor Timothy Taylor in his piece The Bottleneck Story takes another and detailed stab at explaining the COVID induced disruptions to the global supply-chain. Citing work published in the "Bank of International Settlements, Bulletin #48, 11/11/21" by Daniel Rees and Phurichai Rungcharoenkitkul, Taylor brings the following points to our attention:
"...shortages lead to hoarding, and hoarding makes the shortages worse. It’s like the Great Toilet Paper Shortage of 2020 all over again, but this time at a more widespread and macroeconomic level."
However:
"... while these (supply) bottlenecks are very real, the amount of goods being actually moved has been rising and is at high levels. Thus,(additional) bottlenecks have arisen because demand is trying to pull so many goods and services through the pre-existing and disrupted supply chains. The figures (below) show levels of shipping of some key raw materials, semiconductors, and overall container volumes."

"In the short run, a combination of high demand and bottlenecks will push up prices and cause inflation. The BIS economists estimate that if you take out price increases for bottleneck-affected items like energy and motor vehicles, the US inflation rate would have be 2.8 percentage points lower. The question of whether this inflation will last remains unsettled...In the decades since World War II, this kind of inflation has been ended by the Federal Reserve raising interest rates and causing a recession."
Closing on an up note, contributor Kevin Matras writes that the market is heading in the direction of an End Of Year Rally And Multiyear Boom.
"With Q4 GDP expected to accelerate into the end of the year, stocks are poised for a strong end-of-year rally. And with November and December typically being strong months for stocks, it looks like there’s a lot more upside to go. But the gains don’t have to stop there, as we could be on the verge of a multiyear boom."
Image: Bigstock
Matras suggests the following two strategies for taking advantage of this good weather forecast:
"New Highs: As mentioned earlier, studies have shown that stocks making new highs have a tendency of making even higher highs. And this strategy proves it. The alignment of positive price action and strong fundamentals creates all the necessary conditions to see these stocks soar to even greater heights. Over the last 21 years (2000 through 2020), using a 1-week rebalance, the average annual return has been 45.5% vs. the S&P’s 6.6%, which is nearly 7 x the market.
Small-Cap Growth: Small-caps have historically outperformed the market time and time again. Often these are newer companies in the early part of their growth cycle, which is when they grow the fastest. This strategy combines the aggressive growth of small-caps with our special blend of growth and valuation metrics for explosive returns. Over the last 21 years (2000 through 2020), using a 1-week rebalance, the average annual return has been 51.2%, beating the market by 7.6 x the returns."
Matras' basis for his strong enthusiasm?
"The Fed (is) projecting their full-year GDP forecast at 5.9%, which would be the fastest growth rate in 37 years.."
Check the article for more details.
And as always:

If you haven't read this elsewhere, please note that many public health officials are concerned that attention being given to COVID-19 booster shots is shifting focus away from those segments of the population who have yet to receive their first doses of the vaccine. With Thanksgiving travel about to commence, if you fall into either group, please don't travel before you get jabbed.
Have a good one.
I'll see you on Tuesday.


Comments
Log in or sign up to join the conversation.