
Following futures positions of non-commercials are as of May 10, 2022.
10-year note: Currently net short 86k, down 61.6k.
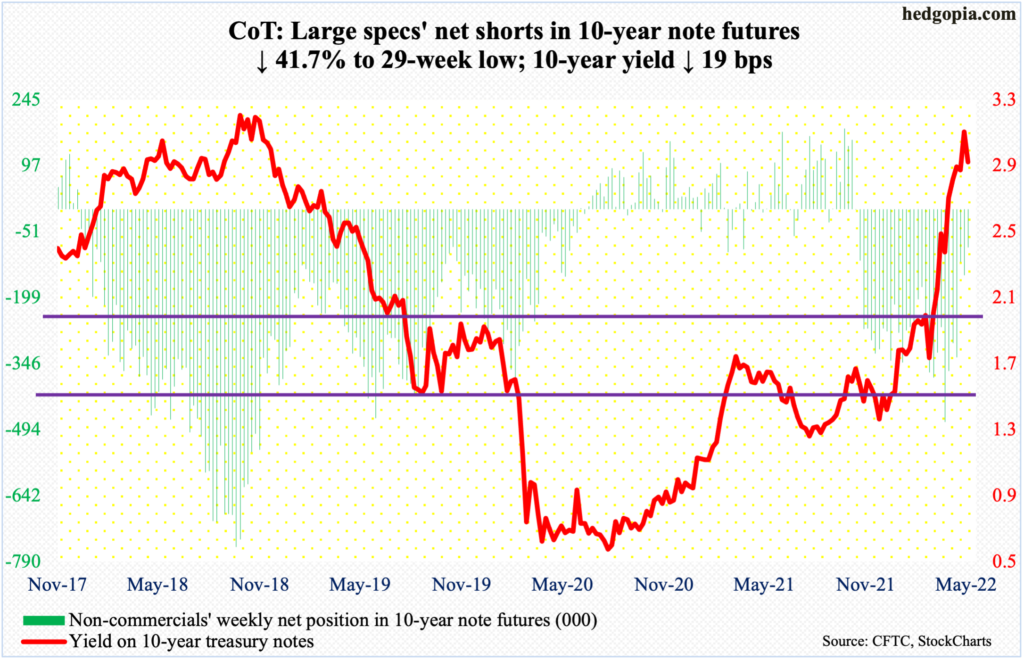
It is probable the 10-year treasury yield made an important high this week. Rates touched 3.17 percent intraday Monday before reversing lower to close at 3.08 percent, ending the week at 2.94 percent, down 19 basis points for the week.
Importantly, the weekly formed a potentially bearish engulfing candle. On the monthly, with May halfway through, a long-legged doji is formed. These are candles that have appeared after a massive selloff in 10-year notes, which yielded 1.13 percent last July and 1.34 percent in early December.
This week’s high came just short of challenging the prior high of 3.25 percent from October 2018. This was also a week in which the consumer price index came in hotter than expected – 8.3 percent year-over-year versus expectations for an 8.1-percent rise.
Markets were looking for signs of a peak in inflation, and they were disappointed. That said, a March peak is still possible, as headline CPI in that month jumped 8.5 percent from a year ago, which was the steepest since December 1981.
At this stage, given the massive drawdown in 10-year notes, bond bears could very well be looking for a pretext to lock in gains. This week’s action could very well be part of that.
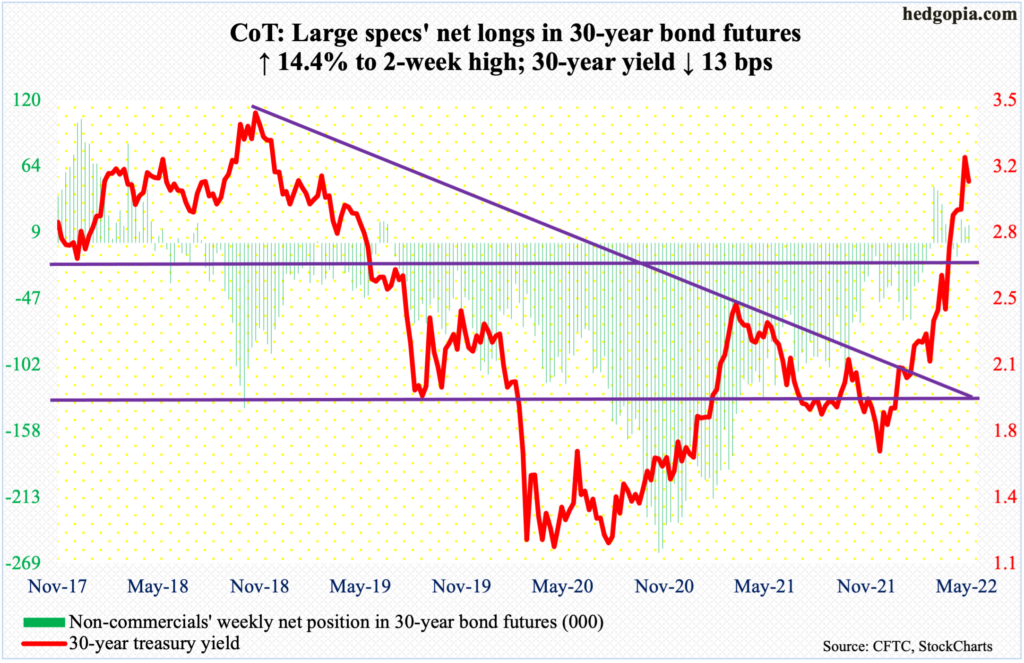
30-year bond: Currently net long 15.5k, up 1.9k.
Major economic releases for next week are as follows.
Treasury International Capital data (March) will be published on Monday. In the 12 months to February, foreigners sold $54.1 billion in US stocks. This represents quite a U-turn on their part as in March last year they were buying $404.7 billion worth, which was a record.
Retail sales (April), industrial production (April) and the NAHB housing market index (May) will be out on Tuesday.
Retail sales rose 0.8 percent month-over-month in March to a seasonally adjusted annual rate of $667.7 billion – a fresh record. In April 2020 post-pandemic, sales were down to $407 billion.
Capacity utilization in March increased 0.8 percent m/m to 78.3 percent, which is a 37-month high.
Homebuilder confidence fell two points m/m in April to 77. This was a seven-month low. The metric peaked at 90 in November 2020, which tripled from the post-pandemic low of 30 from April that year.
Housing starts (April) are scheduled for Wednesday. Starts inched up 0.3 percent m/m in March to 1.79 million units (SAAR), which is the highest since June 2006.
Thursday brings existing home sales (April). March sales were down 2.7 percent m/m to 5.77 million units (SAAR) – a 21-month low; the median price posted a new high of $375,300.
WTI crude oil: Currently net long 317.4k, down 5.8k.
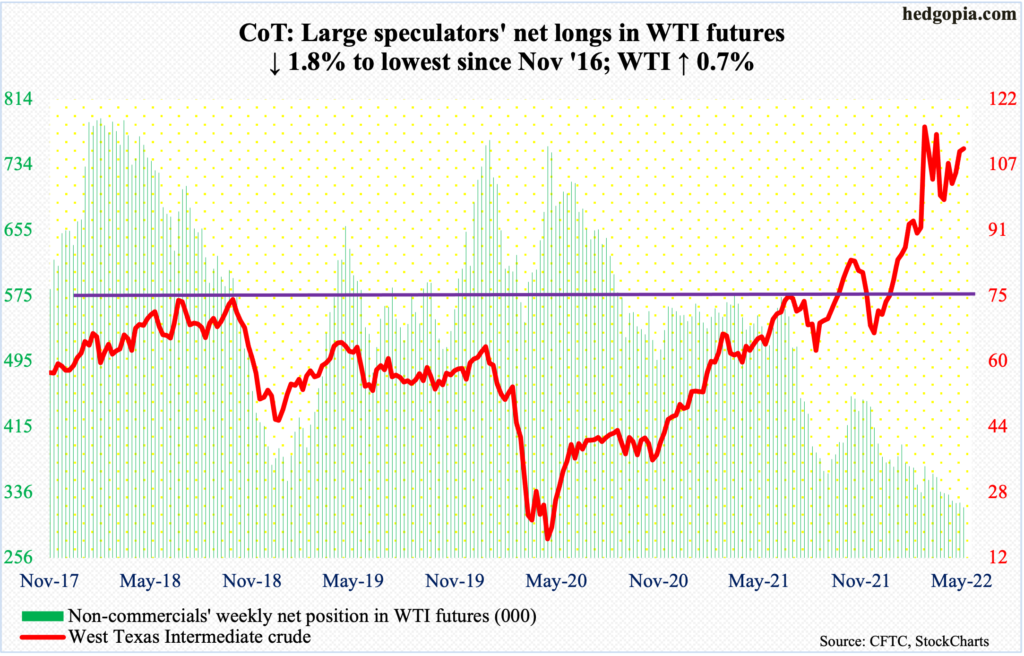
Once again, action revolved around the 50-day, which has acted as a magnet for the last six weeks. Around the average this week, bids showed up at the lower Bollinger band and offers at the upper. The bands are getting tighter, which can be a signal a sharp move – either way – is coming.
Recently, WTI ($110.49/barrel) has attracted sellers at $108-$109, while consistently finding support at $94-$95. The latter in particular could prove to be important in terms of driving sentiment near term.
Immediately ahead, WTI likely tries to rally. This week, the crude was down to $98.20, which was bought, ending the week with a dragonfly doji.
In the meantime, US crude production in the week to May 6 declined 100,000 barrels per day to 11.8 million b/d. As did crude imports, which dropped 63,000 b/d to 6.3 mb/d. Stocks of gasoline and distillates dropped as well – respectively down 3.6 million barrels and 913,000 barrels to 225 million barrels and 104 million barrels. Refinery utilization rose 1.6 percentage points to 90 percent. Crude stocks grew 8.5 million barrels to 424.2 million barrels.
E-mini S&P 500: Currently net long 121.8k, up 69.6k.
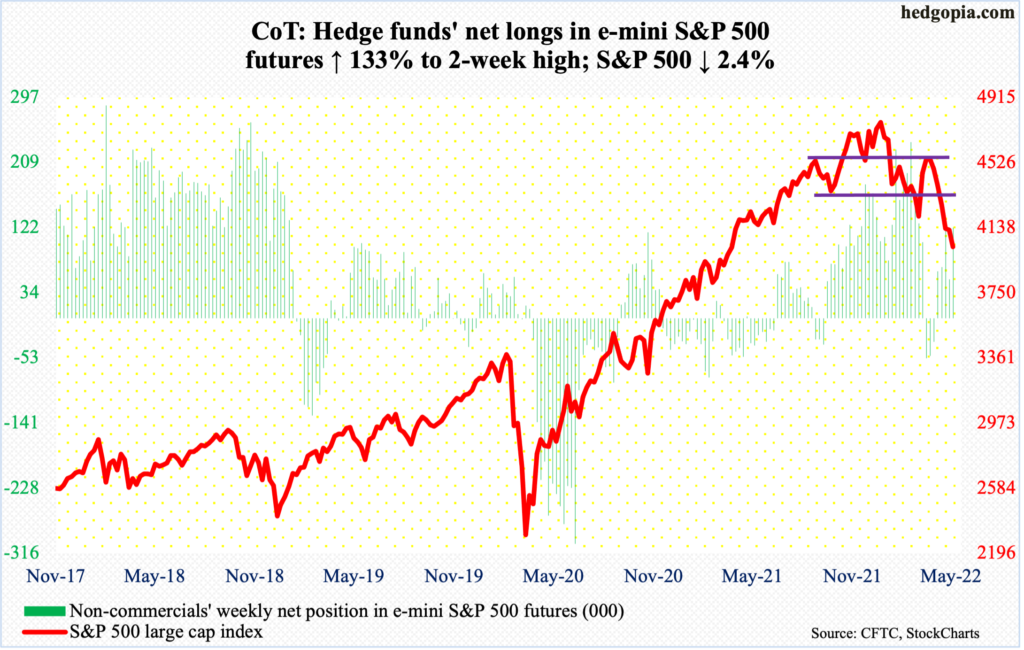
Equity bears picked up where they left off last week. By the time the week was over, the S&P 500 was down 2.4 percent and was down as much as 6.4 percent at Thursday’s low. From the January 4 record high of 4819 through this week’s low, the large cap index tumbled 19.9 percent.
Thursday’s volatile spinning top session would have decisively breached a descending channel if the index closed at its low but was saved by close (more on this here). Ahead of this, only 15.2 percent of S&P 500 stocks were above their 50-day on Wednesday. This is very suppressed territory, although the metric in the past dropped all the way to the one-percent range at major lows.
Concurrently, Investors Intelligence bulls dropped 3.3 percentage points week-over-week in the week to Tuesday to 27.6 percent, which was the lowest since February 2016, lower than the March 2020 low of 30.1 percent (chart here); bears’ count hit 40.8 percent.
Either way we look at it, one after another indicator is screaming oversold. It is just a matter of if these metrics drop a little more to get washed out or begin a rally from here. A rally is possible should the S&P 500 (4024) not breach the channel mentioned above. Friday’s 2.4-percent jump helped the index bounce off this support. Bulls need to recapture 4100 for further momentum. The upper end of the channel lies at 4550s.
Euro: Currently net long 16.5k, up 22.9k.
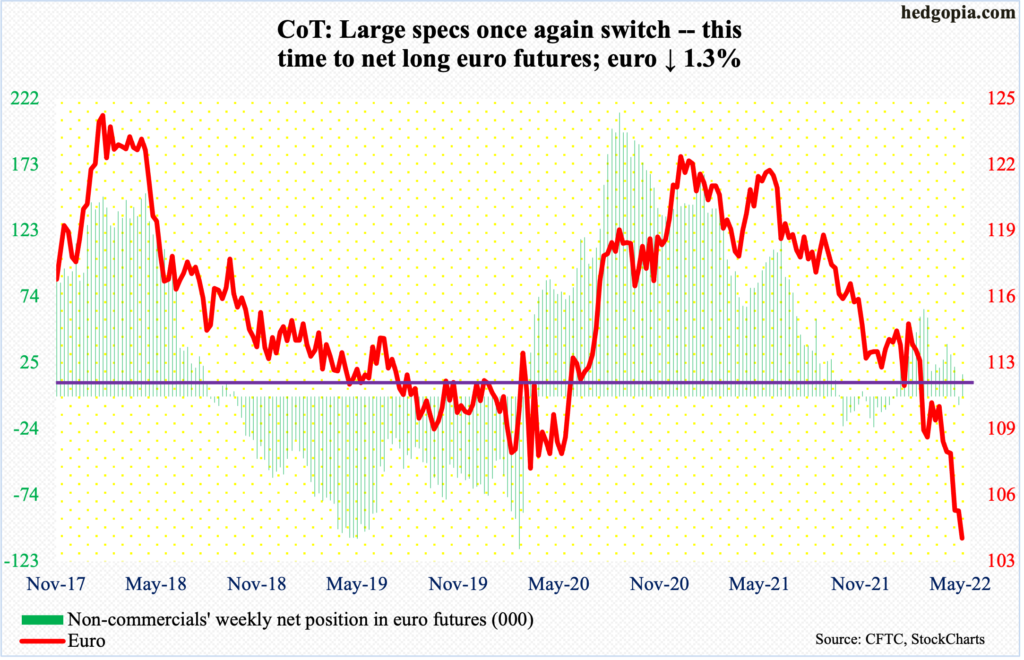
The euro ($1.0413) made further progress this week to get to parity with the dollar. It dropped 1.3 percent – its sixth consecutive down week and 12th out of 14.
The currency was flattish for the week until Thursday’s gap-down losing 1.3 percent, slicing through straight-line support at $1.05-$1.06, which goes back seven years.
The euro has been in a downtrend since it peaked at $1.2345 in January last year and will remain in one until broken, which is yet to occur.
Rally attempts will get tested at gap-down resistance at $1.05.
Gold: Currently net long 193.3k, down 5.9k.
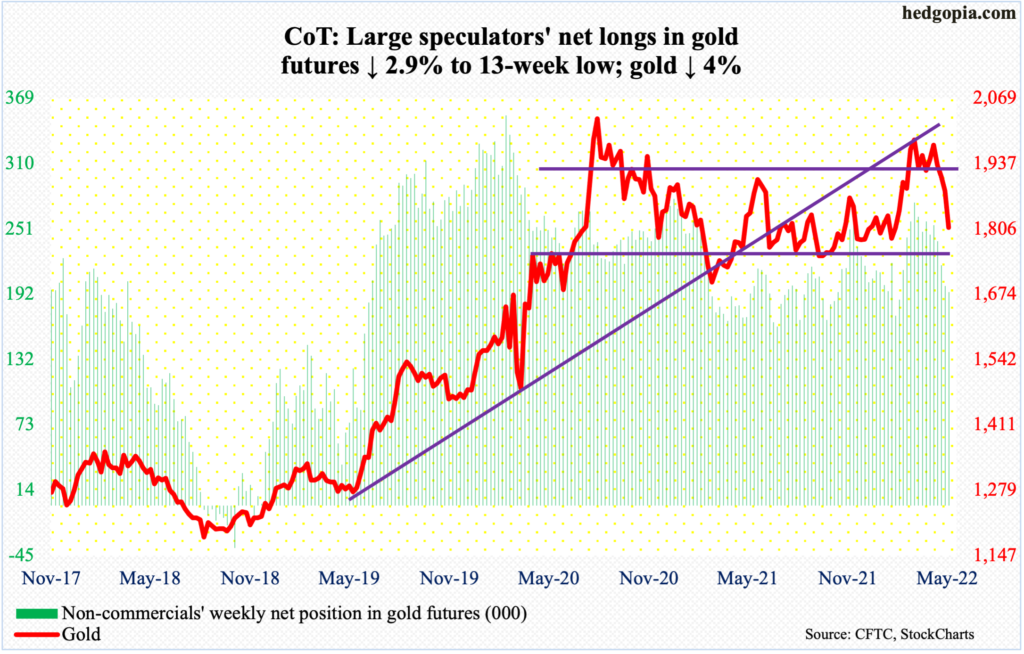
Gold ($1,808/ounce) has been under pressure since it reversed on April 18 after tagging $2,003; a week after that, it lost crucial $1,920s. On Tuesday, it breached the 200-day ($1,837).
This week, the metal gave back four percent, breaching a rising trend line from last August; another trend line from March last year gets tested at $1,800. After that, there is horizontal support at $1,750s, which is immensely important.
Nasdaq 100 index (mini): Currently net long 13.5k, up 2.6k.
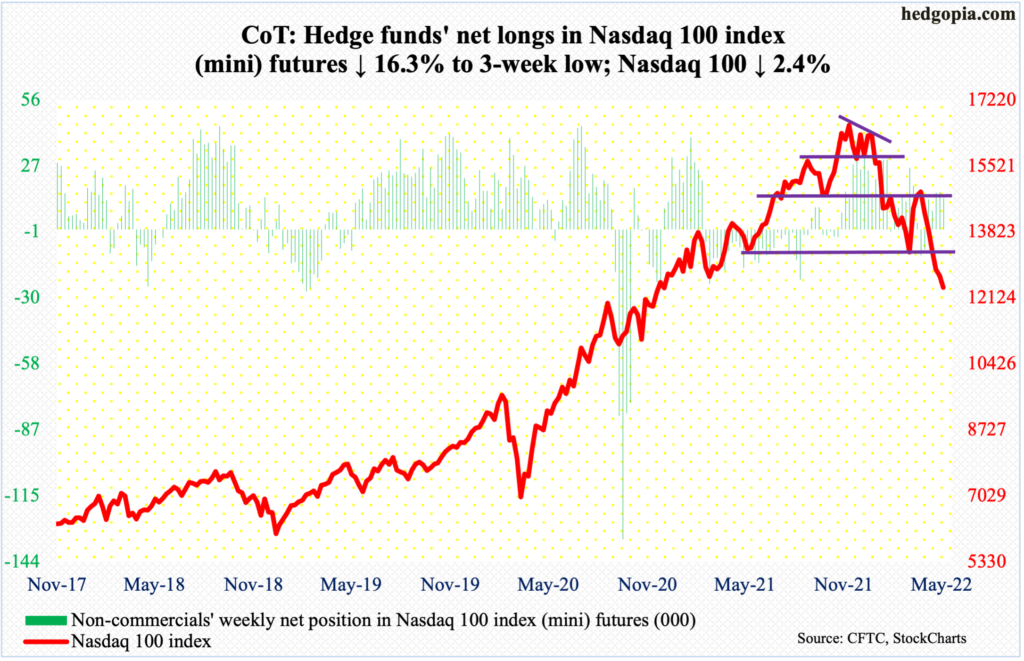
The Nasdaq 100 fell another 2.4 percent this week – its sixth consecutive down week.
If there is any consolation in this week’s trading, it is this. The tech-heavy index peaked last November at 16765. Earlier in March 2020, it bottomed at 6772. A 50-percent retracement of this monstrous rally lies at 11768. This week, it ticked 11692 before drawing bids on Thursday, ending the week at 12387, for a weekly bullish hammer.
It is early to declare a bottom is in, but a reflex rally is the path of least resistance. From last November’s high through Thursday’s low, the Nasdaq 100 plunged 30.3 percent. On Wednesday, merely nine percent of the constituent stocks were above the 50-day. This is panicky territory.
Nearest resistance rests at 13000.
Russell 2000 mini-index: Currently net short 69.6k, up 24.8k.
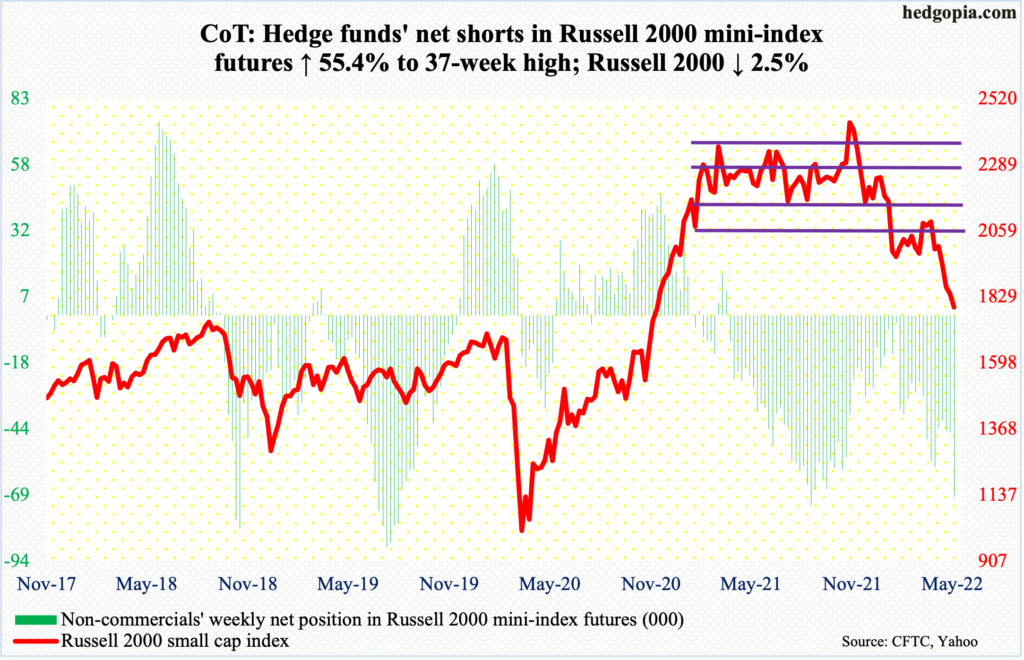
In November 2020, the Russell 2000 broke out of 1700, which until then had proven tough to crack beginning June 2018. Subsequently, the index went on to rally to 2459 by November 2021. The small cap index has been under pressure since, losing 30.8 percent through Thursday’s low of 1701, which, should it hold, will be a successful breakout retest. A lot is riding on this. So far so good. The Russell 2000 closed the week at 1793.
Ahead, 1900 is where the next major resistance lies. For three and a half months now, the index has played ping pong between 2080s and 1900, and for 10 months before that between 2080s and 2350s.
US Dollar Index: Currently net long 34.8k, up 1.7k.
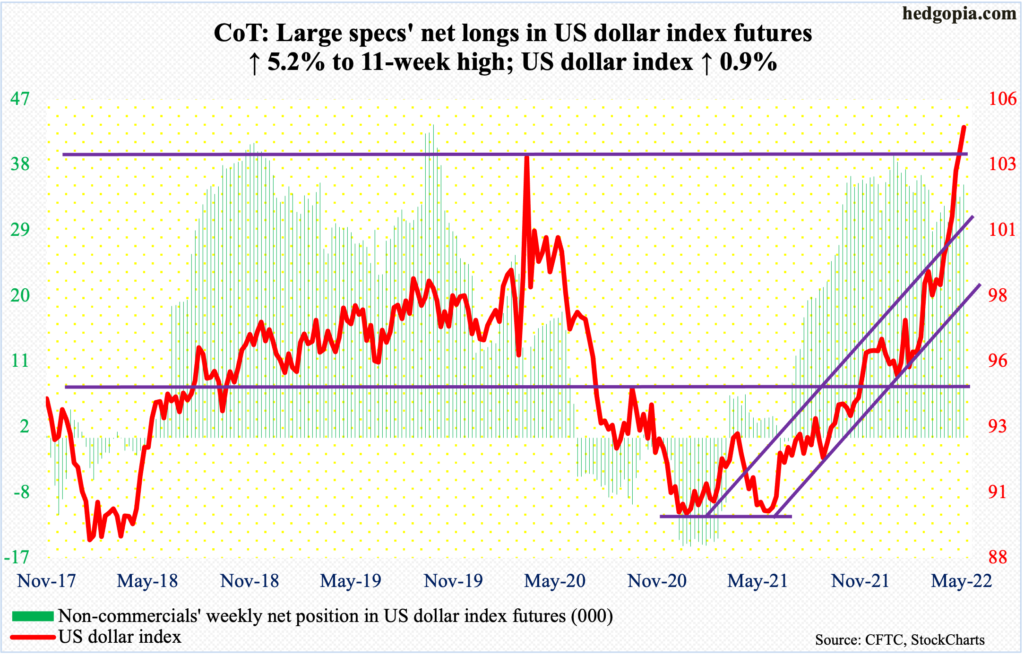
There is no stopping the king dollar.
At least that is how it feels looking at the ongoing relentless strength shown by the US dollar index (104.62). In January last year, it troughed at 89.17.
On Thursday, the index rallied one percent to break out of just under 104, which acted as a ceiling going back to January 2017. It will prove to be a major breakout should a retest – likely soon – be defended with equal enthusiasm.
VIX: Currently net short 47.8k, down 13.9k.
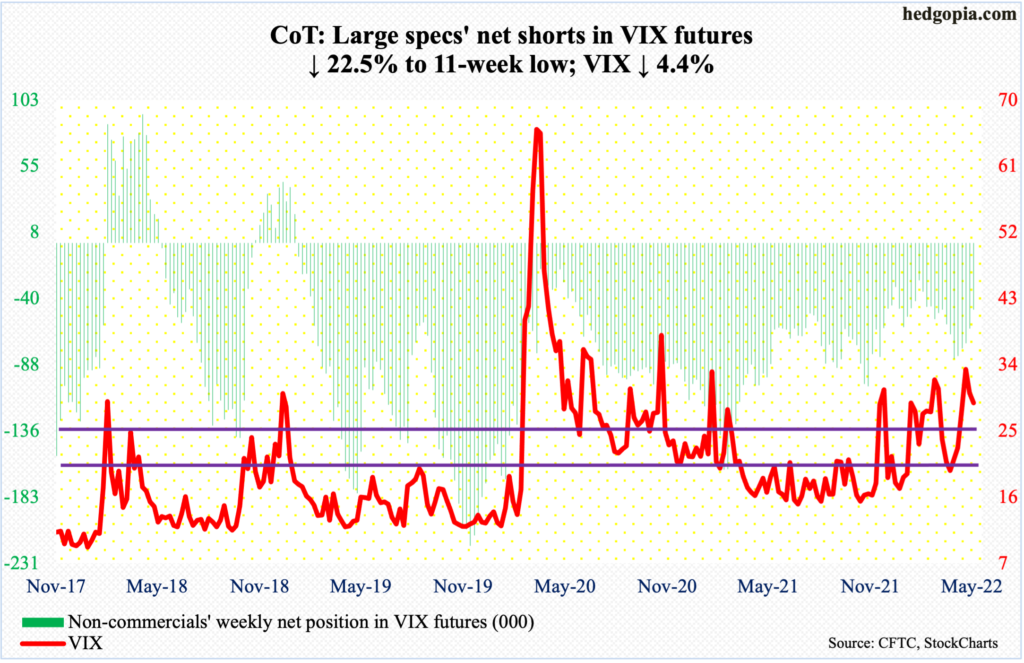
Since January, VIX has had several tries at mid- to high-30s – all unsuccessfully. This occurred again this week as the volatility index tagged 35.48 on Monday. Since hitting 38.94 in January, there has been a pattern of lower highs (on an intraday basis). VIX ended the week at 28.87.
There is straight-line support at mid-20s, which was defended last week, and low-20s after that. These levels respectively coincide with the 50- and 200-day (26.45 and 22.11, in that order).


Comments
Log in or sign up to join the conversation.