
This Is The Craziest Chart You'll See Today
In a world of incredulity, to suggest one chart is the "craziest" may seem a little braggadocio but we suspect after reading below, you will agree...
Something very odd is going on.
Since the beginning of May, the S&P 500 has risen 314 points - a significant surge.
However, as the chart below shows, more than all of those gains have come when the US equity market is closed.
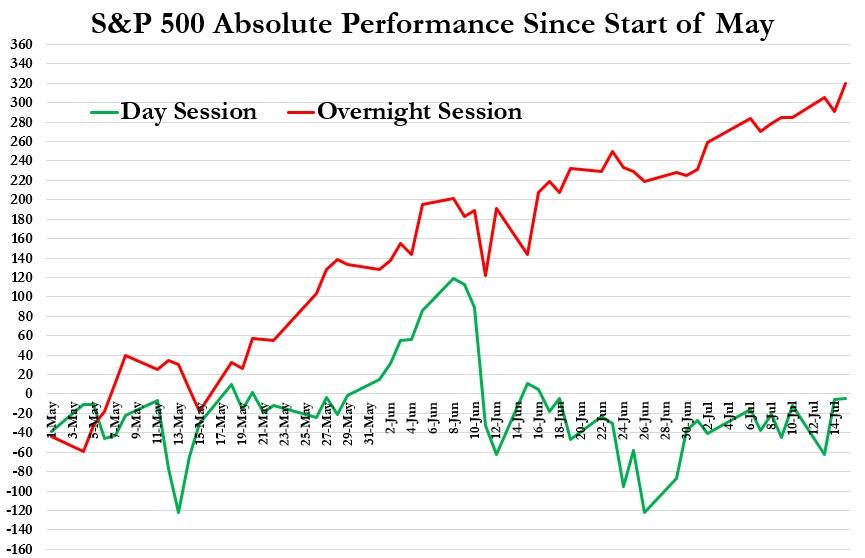
Yes, you are reading that correctly: During the US day session, the S&P has lost 5 points; and during the overnight session (from the cash close to the cash open), the S&P has gained 319 points.
Trade accordingly.
Disclosure: Copyright ©2009-2020 ZeroHedge.com/ABC Media, LTD; All Rights Reserved. Zero Hedge is intended for Mature Audiences. Familiarize yourself with our legal and use policies every time ...
more
How did you like this article? Let us know so we can better customize your reading experience.


The market is rewarding big companies at the cost of smaller ones. The S&P reflects that.