
The U.S. Stock Market Risk Indicator - Future Returns Will Be Poor At Best
More than a decade ago, Mark Thornton wrote an interesting article in the aftermath of the 2000 stock market bubble. The article was titled Who Predicted the Bubble? Who Predicted the Crash? and discussed exactly what the title implies.
Thornton concluded that there were, in general, two groups of correct predictors. The first group based their predictions on equity valuations such as the cyclically adjusted P/E ratio (CAPE) employed by Professor Shiller. The second group came from outside the mainstream economics profession, most notably members of the Austrian school of economics whom based their predictions on economic developments, especially monetary developments.
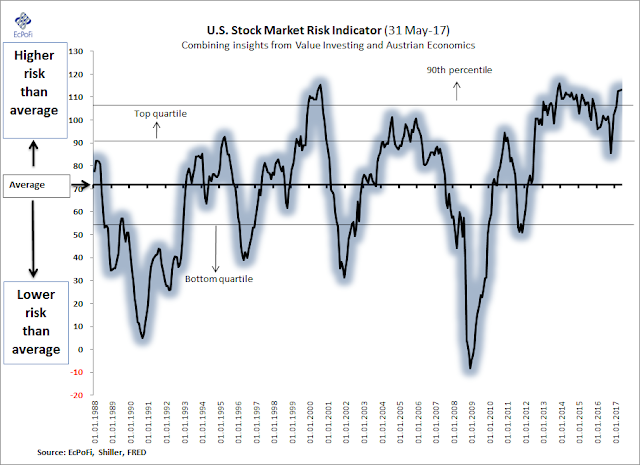
Inspired by Thornton's article, I developed some years back a rather simple stock market risk indicator for the U.S. stock market based on insights from both value investing and the Austrian school. This indicator includes stock market valuations and economic developments from six individual components which are then weighted and compiled into one aggregate (more on this here).
The higher the reading, the greater the risk of a stock market correction. After Trump won the election, the indicator has again been closing in on the all-time high from 2000. As a result, the indicator is now suggesting future stock market returns will at best be poor.
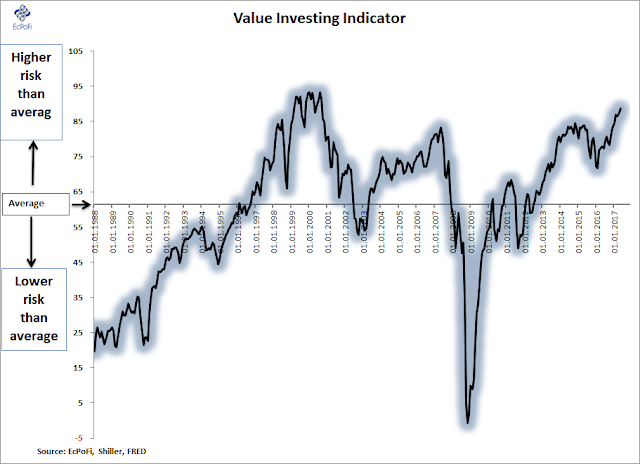
Though the economics reading is also at elevated levels, it is especially the investing part of the indicator that is doing much of the work as it has now surpassed the May 2007 peak.
In short, the indicators suggest this is not the time increase allocations to U.S. stocks (note it says nothing about short-term trading).
Disclosure: None.


