
The US Net International Investment Position, And Projections Of US Net Income
The BEA released estimates for the US net international investment position (NIIP) — the difference between what assets US residents (including the government) own abroad and what US assets foreign residents and governments own. The decline in the value as a share of GDP has stopped, and despite being a large negative number, US net income — income received from assets owned by the US minus income paid on assets owned by foreigners — remains positive. A new CBO working paper (Fried, “CBO’s Model and Projections of U.S. International Investment Holdings and Income Flows” ) tackles the reasons for this seemingly paradoxical phenomenon and the prospects for its continuation.
First, the Q2 figures.
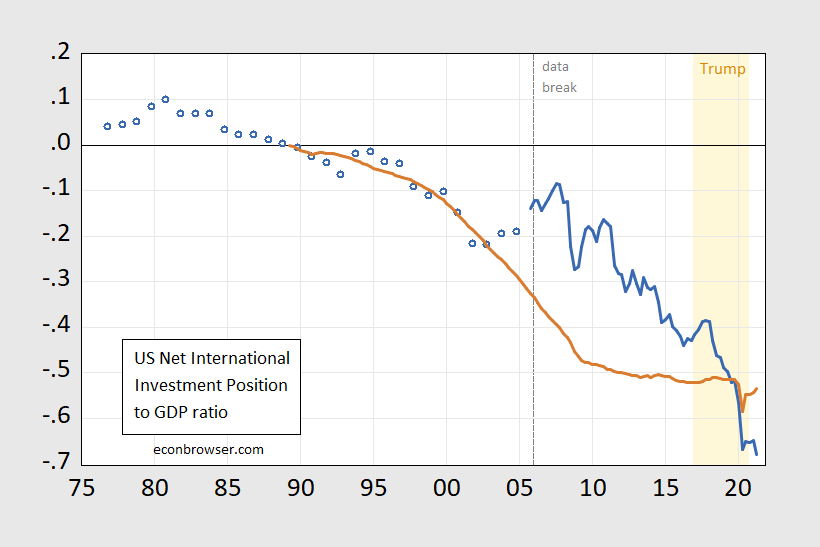
Figure 1: US net international investment position (blue), and cumulative current account balances since 1989Q3 (tan), both as a share of US GDP. Current account figures are on NIPA basis. Light orange shading denotes the Trump administration. Source: BEA via FRED, and author’s calculations.
As discussed in previous posts (e.g., [1]), the US NIIP has deviated substantially from the cumulative current account, largely because of valuation effects (exchange rates, market values of stocks, bonds, fixed investment), as shown in Figure 6 in CBO’s Model and Projections of U.S. International Investment Holdings and Income Flows. Those valuation effects have been working against the US lately so that the NIIP is now substantially below the cumulated current account.
Now despite the US having an enormous net negative position, net income has been — and remains — positive. This is shown in Figure 24 from the working paper:
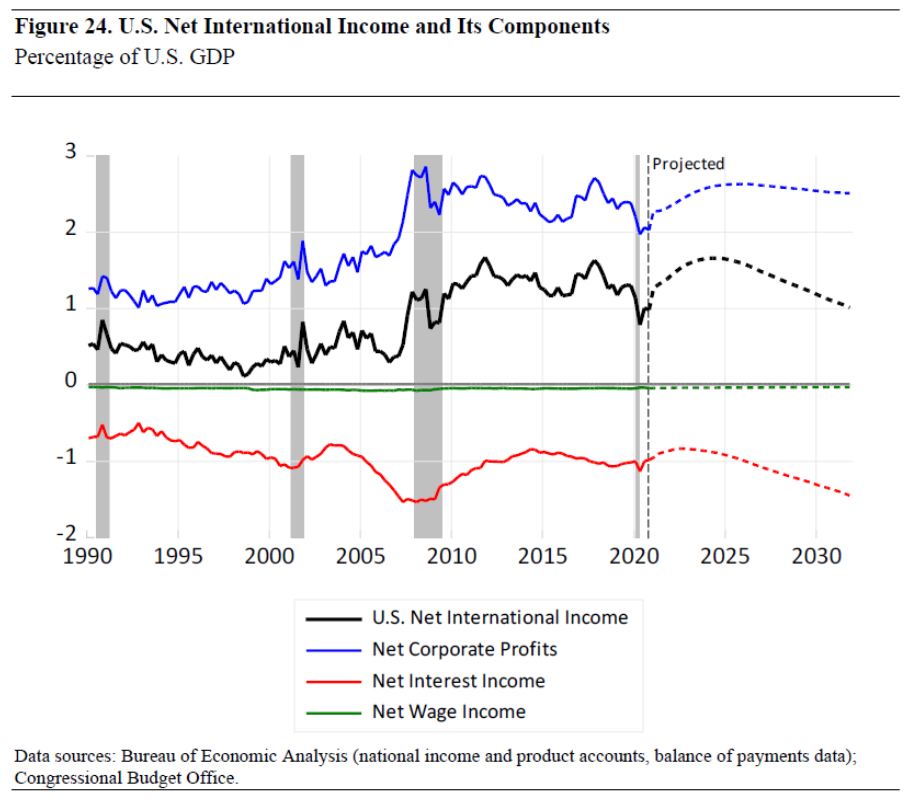
Source: Fried (2021).
Why this outcome? From the abstract:
Since 1982, growth in the value of foreign investments in the United States has exceeded growth in the value of U.S. investments abroad and, as a result, the U.S. net international investment position has been negative and trending lower. Even though the value of foreign investments in the United States has exceeded the value of U.S. investments abroad, the total income earned by U.S. investors on their foreign asset holdings has historically exceeded the total income earned by foreign investors on their U.S. holdings. The United States is able to earn positive net international income despite its negative net international investment position because the average yield on U.S. investments abroad has exceeded the average yield on foreign investments in the United States.
The Congressional Budget Office uses its international financial forecasting model to project international capital and income flows. It includes two types of forecasting equations: those that project international asset positions and those that project the income generated by those assets. Over the 10-year forecast period, growth in the value of U.S. holdings of foreign assets is projected to exceed growth in the value of foreign holdings of U.S. assets; consequently, the U.S. net international investment position is expected to rise modestly. In addition, the international yield differential is projected to remain high and roughly steady over the next decade. As a result, net international income is expected to rise as a share of U.S. gross domestic product through 2023 before declining through 2031 (because of higher interest payments on U.S. federal debt held by foreign investors). [emphasis added]
The US is projected to retain this positive net income flow. The calculations are carefully laid out in the working paper, which is well worth reading if one is interested in how the US might continue to enjoy this situation.
Those who are interested in how these calculations might link up with the ability of the Federal government to finance deficits can refer to this section.
Official Holdings of U.S. Federal Debt. CBO projects growth of foreign official holdings of U.S. federal debt assets as a residual from its projections of the current-account balance, projections for all other asset classes, and the relationship between the current account and changes in the NIIP. This variable was chosen as a residual because it is driven by factors that are hard to measure. For example, it is difficult to explain the growth in official debt holdings in the late 1990s and early 2000s as a function of existing model variables.
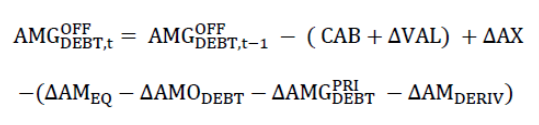
The equation used to project official holdings of U.S. federal debt exploits the relationship between the current account and changes in the NIIP. Changes in the NIIP can be explained by two factors, net purchases of international assets and changes in asset valuations:
In that equation, the U.S. current-account balance, CAB, is a measure of net capital flows into a country (if positive) or out of a country (if negative).26 The CAB is also equal to the sum of the trade balance (exports minus imports), net international income, and net unilateral transfers. When U.S. imports fall, the U.S. trade deficit also falls. That decline in the trade balance necessitates fewer capital outflows to pay for that smaller U.S. trade deficit; those changes increase both the U.S. CAB and the NIIP. When U.S. net income from abroad rises, that change in income is a capital inflow; it increases the U.S. CAB and the U.S. net international investment position.
Projections of the current-account balance are driven by changes in national saving and investment. Increases in domestic saving (relative to domestic investment) reduce a country’s reliance on foreign capital to fund domestic investments and increases the country’s NIIP. CBO projects future valuation changes ΔVAL as a function of the long-run average of past valuation changes as well as projected changes in the trade-weighted value of the dollar. Then, based on the forecasts for all other international asset variables, CBO projects foreign official holdings of federal debt using the following equation:
In CBO’s model, projections of foreign official holdings of U.S. federal debt depend on projections of all other international asset and income variables. For example, those holdings will be sensitive to changes in the U.S. trade balance.27 Holding all else equal, CBO estimates that a growing trade deficit will increase the current-account deficit and, in turn, foreign holdings of U.S. federal debt. In addition, those holdings will grow with increases in U.S. holdings of foreign assets but will decline with increases in all other foreign holdings of U.S. assets, CBO projects. To the extent that projected valuation changes are not reflected in changes in the value of other international assets, those changes will flow through to CBO’s projected foreign official holdings of U.S. federal debt.
One observation relevant for those of us used to a seemingly endless appetite for US Treasury debt on the part of the foreign official sector (i.e., central banks, SWFs) — the appetite seems to have moderated.
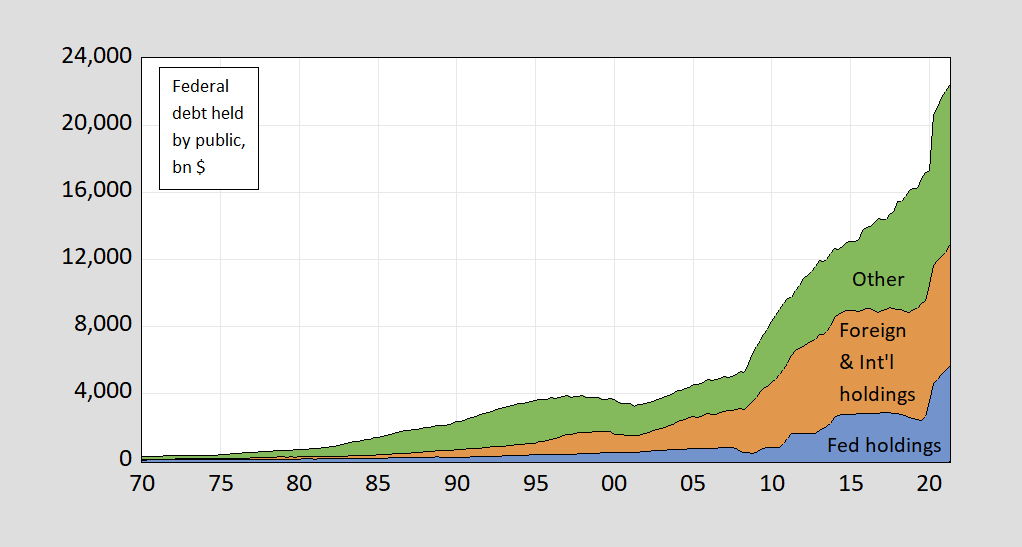
Figure 2: Holdings of US Treasury debt held by the public, by Federal Reserve Banks (blue), by foreign and international organizations (tan), and by all other (green), all in billions of dollars, nsa. Source: Treasury via FRED, and author’s calculations.
Disclosure: None.


