
It is very difficult to track the impacts of Tariff-palooza! on the US supply chain, due to delays in any sort of accurate reporting. But below is the best overall picture I have been able to decipher.
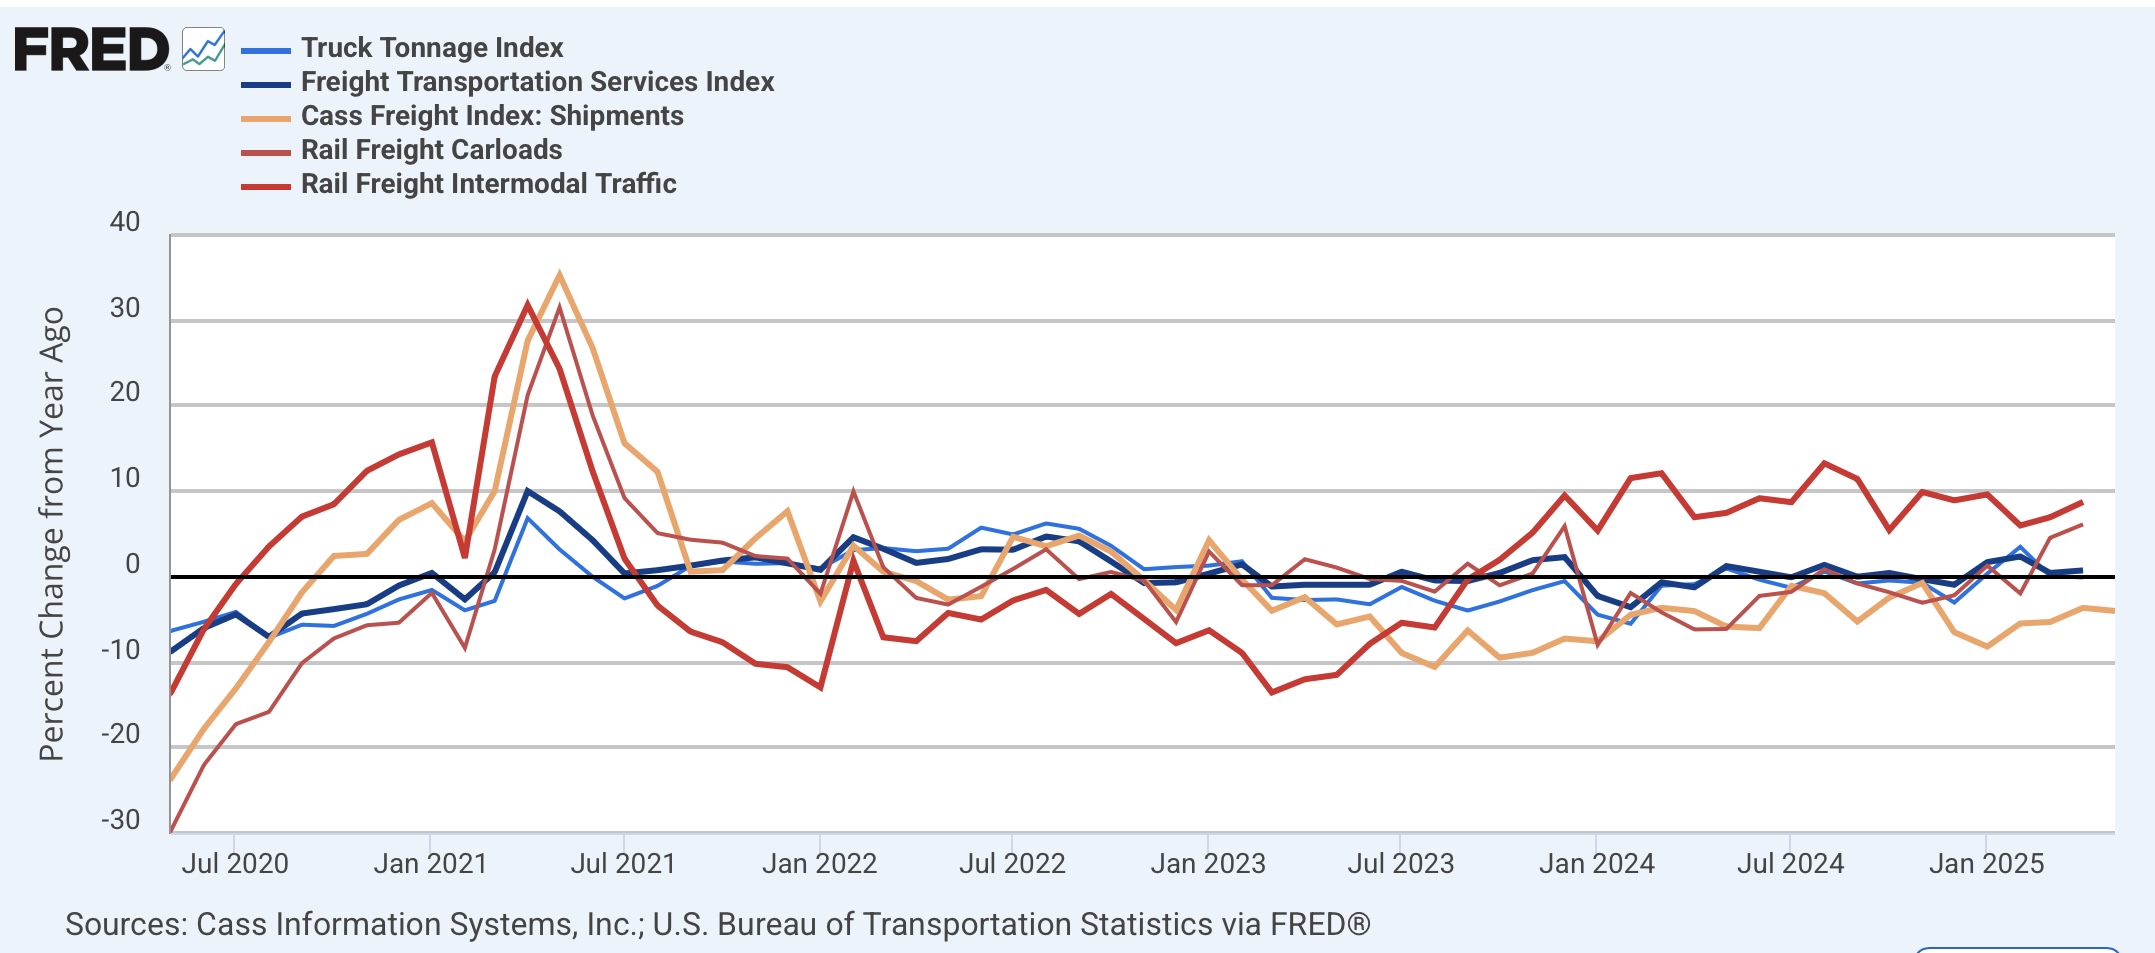
Mainly the delay is focused on the trucking industry, because rail is very concentrated and reports in detail each week. Below is the agglomeration of intermodal (dark red) and total (light red) rail traffic, the Cass Freight Index for trucking (gold), the Truck Tonnage Index (light blue), and the Freight Transportation Services Index for all types of freight (dark blue), all normed to 100 just before the pandemic:
(Click on image to enlarge)

Note that of these, only the Cass Freight Index has been reported for May. The rest are only current through April.
Earlier this week I showed that intermodal rail traffic had turned negative for the past three weeks. In this week’s report, the AAR’s total freight reading also turned negative YoY:
(Click on image to enlarge)

The AAR also reports a monthly graph for all loads except coal and grain. Here is the update through May:
(Click on image to enlarge)
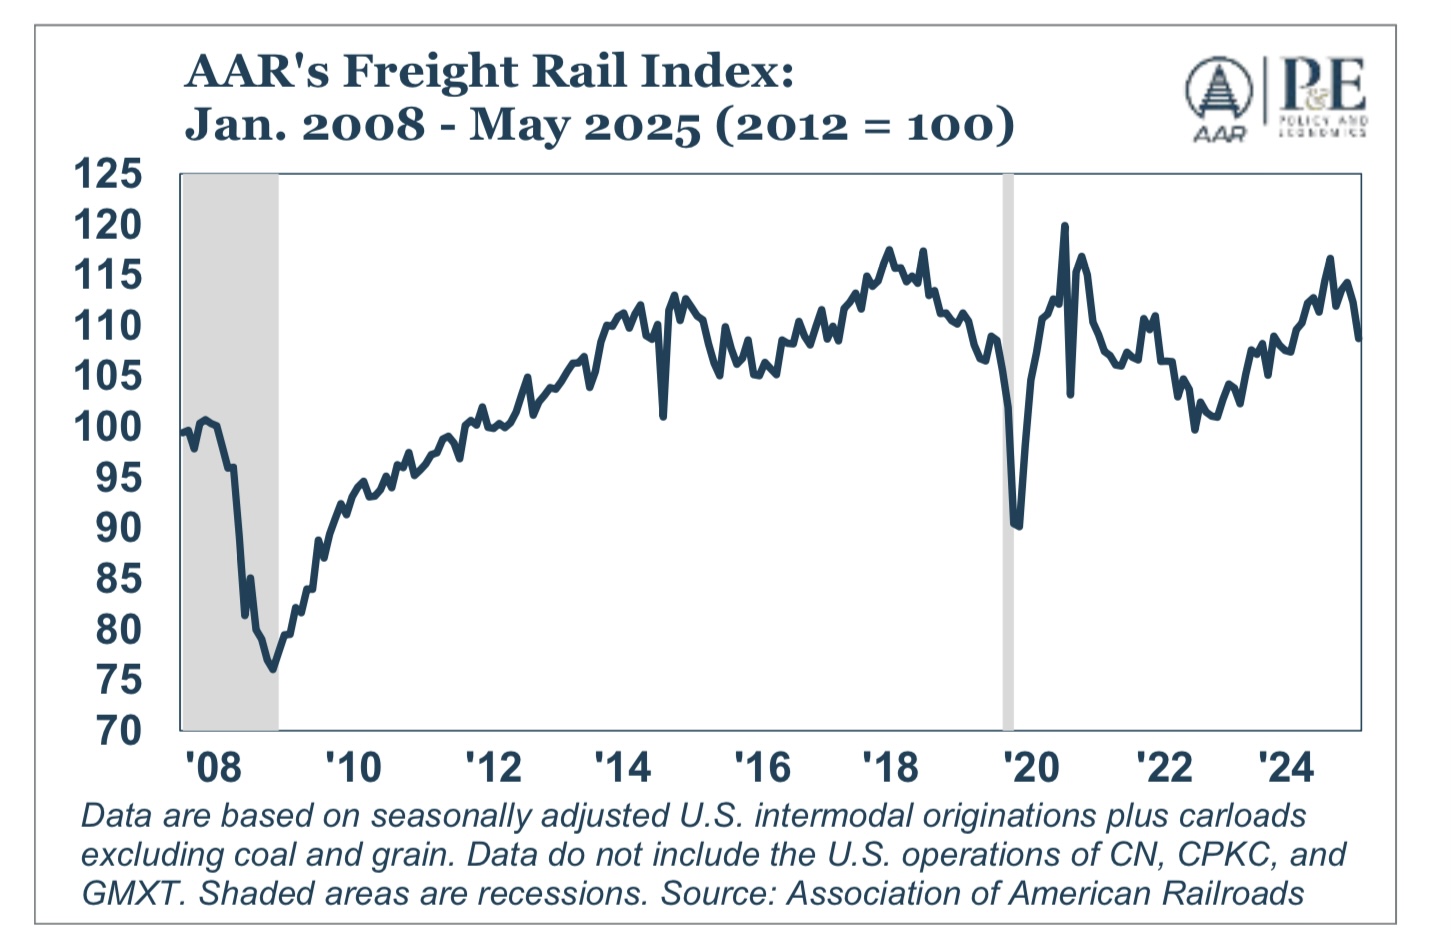
This is a fairly serious turndown. Notably, coal loads have been well above last year’s levels, but the AAR ascribes that to the fact that much of these loads moves through Baltimore, and last year as you may remember the fallen Francis Scott Key blocked the harbor for several months. Of interest, coal loads are below their 2023 numbers:
(Click on image to enlarge)

The trucking industry’s own index was last reported in May for April, showing a monthly decline, but the YoY comparison was higher by 0.1%:
(Click on image to enlarge)

As they wrote: “In April, the ATA advanced seasonally adjusted For-Hire Truck Tonnage Index equaled 113.0, down from 113.3 in March. The index, which is based on 2015 as 100, was up 0.1% from the same month last year, the fourth straight year-over-year increase, albeit the smallest increase over this period.”
Their report for May should be released in the next 7 to 10 days, and should be much more illuminating.
Historically, the Cass Index has been the most sensitive to the downside. As the below two graphs indicate, you need the *total* freight index, including both rail and trucking, to decline YoY in order to suggest that a recession is likely:
(Click on image to enlarge)

As indicated above, the total Freight Transportation Services Index was just updated this week for April. The YoY view shows an increase of 0.7%:
(Click on image to enlarge)
That’s anemic, but it is still positive. We should have a much better idea of what May looked like once the Trucking Index for May is released later this month.
More By This Author:
New 21 Month High In The Four Week Average Of Initial ClaimsConsumer Price Inflation: Once Again, All Clear Except For (Slowly Disinflating) Shelter
Updating Some High Frequency Metrics For Economic Activity


Comments
Log in or sign up to join the conversation.