
One of the puzzles of current times is why overall assessments of the economy have not risen in accord with actual developments (say, as summarized by the Misery Index), and relatedly why those gains have not redounded to the incumbent president’s approval ratings (discussion here). I don’t have answers, but I have some observations.
Economic Conditions and (Measured) Economic Sentiment
First, how much as the current reading of the Michigan Index of Economic Sentiment (FRED series UMCSENT) deviated from what is expected over the past 30 years? Pictured in Figure 1 is the actual UMCSENT series (red), the fitted series (green), and residuals (blue).
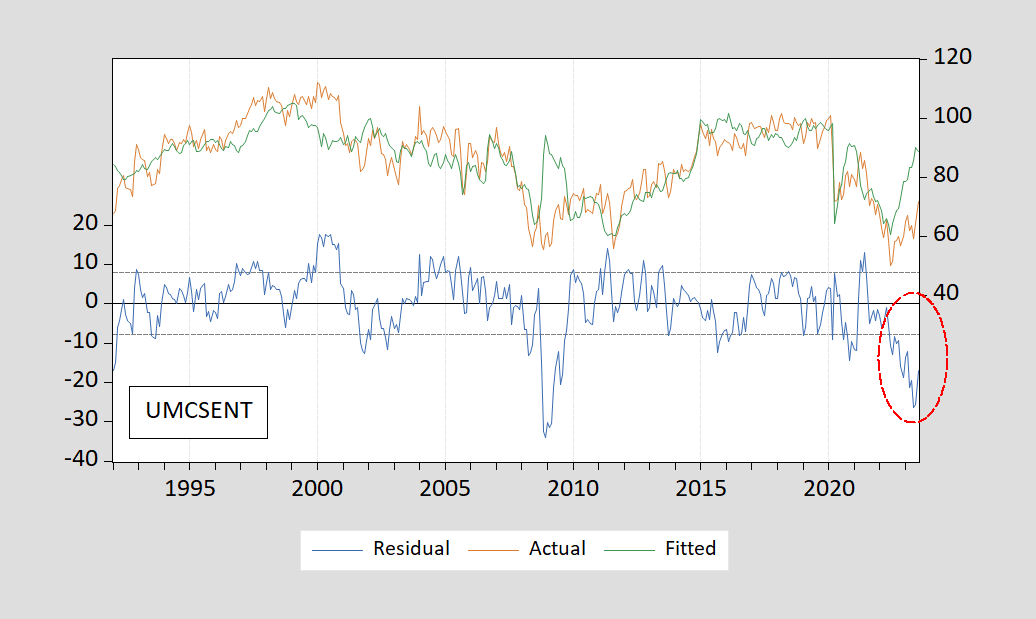
Figure 1: Actual, fitted, and residual for UMCSENT regression.
The regression (used in my previous post on this subject) is (gasoline price is CPI deflated):
UMCSENT = 44.26 – 4.06MISERY – 16.4pgasoline
Adj-R2 = 0.61, SER = 8.30, DW = 0.28, Nobs = 379, sample 1992M01-2023.07. Bold Italics denotes significance at 10% msl, using HAC robust standard errors.
(I have used Bloomberg consensus for July unemployment rate, and Cleveland Fed 8/1 nowcast for July CPI.)
Carola Binder has an excellent discussion of partisan effects in sentiment, current and expectations. Here, I focus on the differential impacts of Misery Index components (the unemployment rate and the y/y CPI inflation rate) on the disaggregated sentiment indexes. First, here’s a picture of the different series.

Figure 2: University of Michigan Index of Economic Sentiment (bold black), for Democrats (blue), for Independents (chartreuse), for Republicans (red). NBER defined peak-to-trough recession dates shaded gray. Source: University of Michigan via FRED, University of Michigan, NBER.
Note that the Republican view is much more positive than Republicans during the Trump administration, but switched to much more negative during the Biden. This is a reflection of the well known tendency for sentiment to be much higher than otherwise when the president is a member of the respondent’s party. It would be nice to see if this effect is stronger in more recent times than previous decades, but a fairly continuous time series is not available before 2006, so it’s hard to answer this question.
As of July, Republicans have a 51 reading, while Democrats have a 92 reading.
How different to Democrats, Independents and Republicans view economic conditions based on realizations of unemployment and inflation? I investigate this question by regressing various UMCSENT measures on these variables as well as a dummy variable for a Democratic president.
UMCSENTit = α0 + α1Ut + α2πt + α3DEMPRESt
Where i = overall, Democrat, Independent, Republican, 2006M01-2023M07. UMCSENT is divided by 100, Ut and πt are in decimal form. Table 1 presents the results.
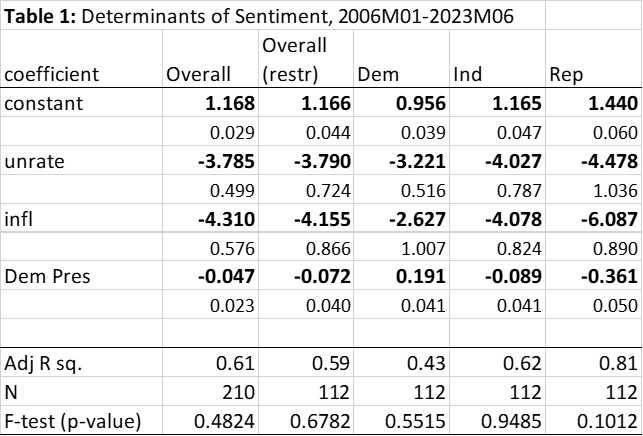
Notes: Bold face denotes significance at 10% msl using HAC robust standard errors. F-test (p-value) is p-value for restriction that coefficients on unemployment and inflation are the same.
Column 1 shows the results for the UMCSENT (overall) drawn from FRED. The unemployment rate and inflation rate show up with about the same sized coefficient. Democratic presidential administrations show up with a negative coefficient: a Democratic president is associated with a 0.05 reduction in UMCSENT (mean of normalized index is 0.86). If one restricts the sample to the same period for which we have the disaggregated results (column 2), then results are largely the same; hence the period for which we have the disaggregate data does not appear to be anomalous.
Democrats appear to place slightly lower weight on inflation than on unemployment — but not a statistically significantly lower. In contrast, Republicans place significantly higher weight on inflation than on unemployment (the F-test nearly rejects the null of equal coefficients).
The coefficient on the dummy variable confirms the finding that views on the economic state are more positive when the presidency is held by someone of the same political party/affiliation: the coefficient on DEMPRES is positive for Dem (+0.191), and negative for Rep (-0.361), and slightly less negative for Ind (suggesting that Ind are more like Rep than Dem). Generally, the standardized coefficients (“beta” coefficients) indicate largest impacts are associated with the dummy variable.
There is an asymmetry in the impact of presidential party affiliation. During this period (2006-2013), Republicans have an outsized impact of presidential affiliation — 0.361 vs. 0.191 (in absolute value). Ceteris paribus, they really view conditions negatively when a Democrat holds the presidency.
Interestingly, while both Ind and Rep sentiment depends on the unemployment and inflation rates (Adj R2 around 0.5), Dem sentiment is largely unexplained (Adj R2 around 0.04). The y/y growth rate of the real S&P500 seems to have a much larger impact (as measured by the “beta” coefficient) for Dem than for Rep or Ind.
(Measured) Economic Sentiment and Biden Approval
A commonplace refrain is that Biden is not getting credit for the strong performance of the economy. This point is verified by inspecting Biden’s approval rate trend (from FiveThirtyEight) and the sentiment indexes.
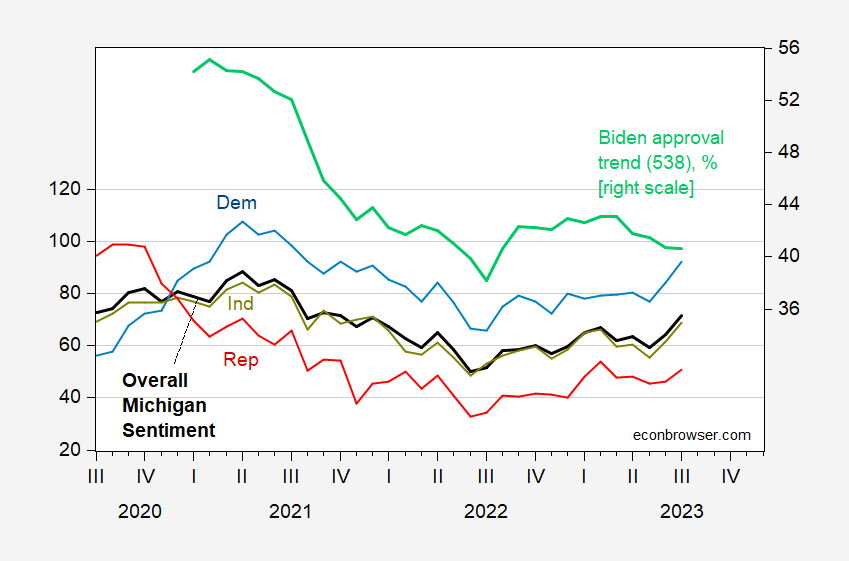
Figure 3: University of Michigan Index of Economic Sentiment (bold black, left scale), for Democrats (blue, left scale), for Independents (chartreuse, left scale), for Republicans (red, left scale), Biden Approval Trend, % (light green, right scale). Source: University of Michigan via FRED, University of Michigan, FiveThirtyEight.
Using the relationship between UMCSENT and Biden approval over the 2021M11-2023M07 period, the July Biden approval rate should be 43.1, as opposed to the 538 trend value of 40.5.
More By This Author:
Defense Spending Over TimeGDP, GDO, GDP+
Business Cycle Indicators At July’s End


Comments
Log in or sign up to join the conversation.