

Image Source: Pixabay
Editor Note
I am traveling this weekend for the Christmas holidays with the family. Therefore, I don’t have access to all of my usual data and analysis. However, I did not want to miss the opportunity to send you at least a short note. The following Market Brief and Technical Update, ahead of next week’s year-end wrap-up, will guide you.
As such, the full newsletter will return next weekend. In the meantime, I want to wish you all a very blessed, happy, and prosperous New Year.
Market Brief – The Santa Claus Rally Begins
U.S. equity markets began the holiday‑shortened trading week on a firm footing. Broad gains in major indexes and the start of the Santa Claus rally marked this week. Following modest volatility in trading earlier in December, sentiment improved significantly as investors bet on year-end flows. As shown, the CNN Fear-Greed Index has moved materially higher from its readings earlier in the month.

(Click on image to enlarge)
Furthermore, the seasonal patterns that have historically favored stocks continued, and they bode well for a year-end push.

(Click on image to enlarge)
The Santa Claus rally window officially began on Christmas Eve. That rally is traditionally defined as the final five trading days of December, plus the first two of January. This seasonal effect has occurred in roughly three‑quarters of years since the 1950s, with positive average returns of 1.4%. However, that did not happen in the last two years, but there have never been three consecutive years without a positive return.
Despite a strong seasonal start, trading remained light throughout Christmas week. On Friday, markets dipped slightly in thin post-holiday trading, with the S&P 500 retreating marginally. That pullback reflected the typical lack of liquidity during this period.
The Santa Claus rally spilled over into gold and silver, which hit record levels, driven by expectations of lower interest rates and persistent market uncertainty. But the pace and shape of these rallies are unusual. Parabolic breakouts often occur when price momentum accelerates rapidly, driven by speculative capital and short‑term positioning, rather than by gradual accumulation based on long‑term fundamentals. Recent reports indicate that speculative traders are adding aggressive net long positions in silver futures, amplifying momentum beyond typical levels.
Fundamental support for precious metals remains. Physical demand, supply constraints, and geopolitical tensions underlie current price levels. But the intensity of the recent rally suggests speculative forces are in play alongside fundamentals. Investors should prepare for higher volatility, and understand that a speculative peak often precedes a corrective phase, not a straight continuation of the parabolic trend.
Overall, the start of the Santa Claus rally and record index levels reflect persistent confidence among investors, even as market leadership shifts and year‑end thin trading raise the potential for volatility. Strategic positioning now hinges not only on seasonal history but also on evolving monetary policy expectations and corporate earnings outlooks as the new year approaches.
Technical Backdrop – Market Rallies As Expected
The technical picture for U.S. equity markets remains bullish but precarious as the year draws to a close. Major indexes are trading near key highs, but momentum indicators and price structure suggest caution in the near-term.
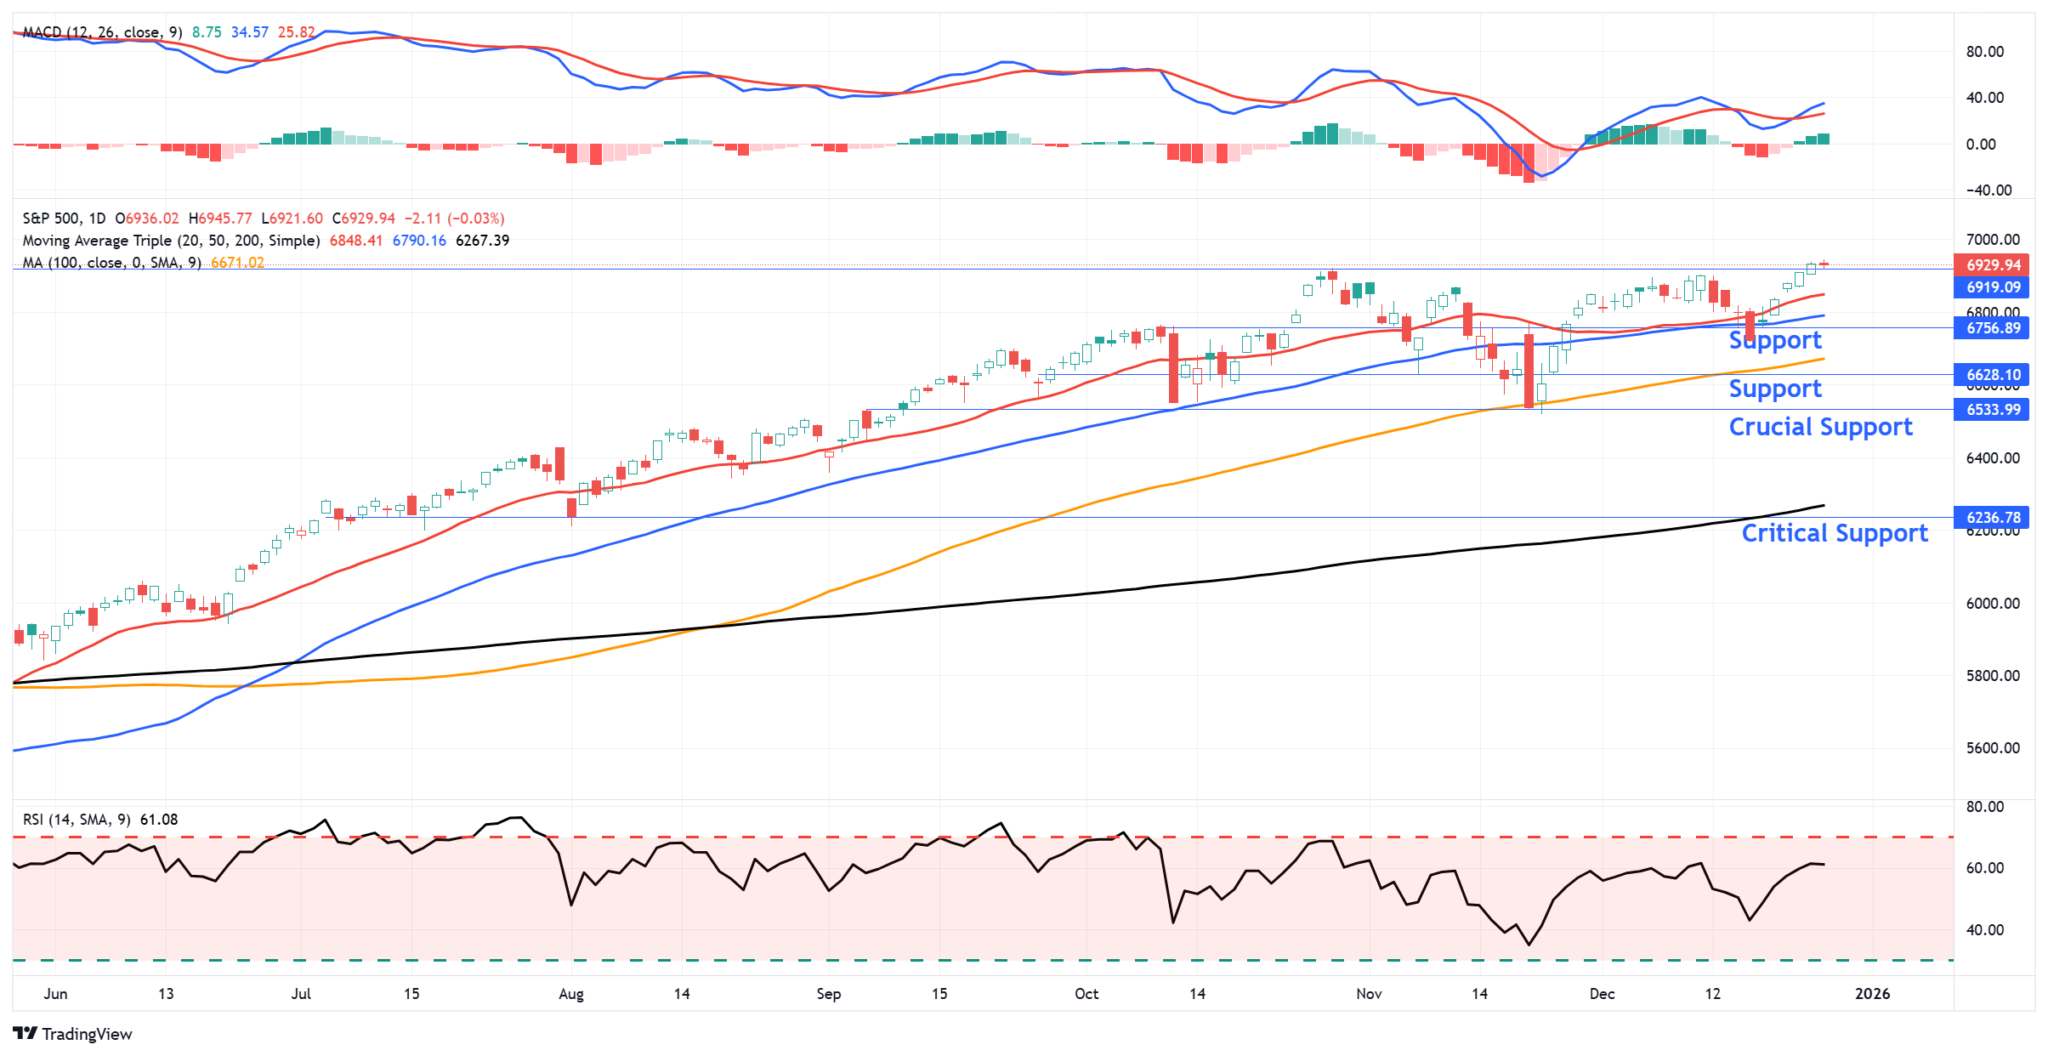
The S&P 500 continues to hover just under all‑time highs, reflecting the Santa Claus rally, as the index reached fresh record levels earlier in the week before pulling back modestly in thin post‑holiday trading. The S&P 500’s proximity to prior highs has created a critical technical inflection point. The 7,000 level remains a key target for the markets to trade toward, and with markets just 80 points away, the goal could be reached early next week.
Support for the S&P 500 is situated in a confluence zone between 6,850 and 6,880, an area that capped recent rallies and served as resistance before the brief breakout. Should price fall back below this area, the next significant cushion lies nearer the 6,760–6,780 range. A break below that zone would suggest weakening internal breadth and could signal a deeper pullback toward mid‑December support levels in the 6,600s.
Updating our chart from last week, we see the minor breakout above previous all-time highs, and the triggering of a fresh momentum “buy signal,” which is also supportive heading into next week.
(Click on image to enlarge)
However, heading into next week, such a pullback seems less likely, but not impossible. As such, investors should continue to monitor and manage risk accordingly.
Momentum indicators such as RSI remain elevated but not yet extreme, implying that while the trend is intact, the upside extension could tire without a fresh catalyst. Seasonal patterns and low liquidity during holiday trading often distort technical signals, increasing the probability of false breakouts and whipsaw price action as we move further into the New Year.
From a risk management perspective, consider taking some profits and rebalancing risk toward the end of next week if the market pushes toward 7,000.
Specific Key Levels to Watch Next Week
- S&P 500 Support: 6,848, which is the running 20-day moving average.
- Next Support: 6,790 just below at the 50-day moving average
- Crucial Support: 6,671 is the 100-day moving average.
- Critical Support: 6,267 is the 200-day moving average
- S&P 500 Resistance: 6,940-ish, which was Friday’s intraday high.
Technical risk remains asymmetrical. A clean breakout above resistance would justify continued positioning. At the same time, failure to hold key support zones would shift focus to deeper retracements early in 2026, especially if liquidity thins further and sentiment deteriorates.
Key Catalysts Next Week
As the markets transition continue the Santa Claus rally next week, catalysts are concentrated around monetary policy insight and sparse macroeconomic data. Thin holiday liquidity increases the potential impact of isolated releases. Investors should prepare for volatility around the Fed minutes and select housing and leading indicators that could influence early 2026 positioning.
The Federal Open Market Committee (FOMC) meeting minutes, scheduled for Tuesday, Dec. 30, are the standout catalyst. The minutes will provide deeper insight into the Federal Reserve’s current thinking on inflation dynamics, labor markets, and the likelihood and timing of future rate adjustments. After the Fed’s recent series of rate cuts and Powell’s “wait and see” commentary, markets will be parsing language for shifts in tone and future guidance.
Other scheduled releases are modest but still relevant for sentiment and intermediate trends. Pending home sales on Monday, and S&P Case‑Shiller home price data on Tuesday, offer incremental insight into the housing market. Higher rates and affordability pressures continue to be the primary concerns.
Finally, global data including Chinese purchasing managers’ indexes on Wednesday, Dec. 31, could influence risk appetite and commodity demand expectations, particularly in industrial metals and energy markets.
With the calendar light, the Santa Claus rally will depend more on narrative and positioning than data, increasing the influence of technical levels and seasonal flows on direction. Record highs in major indexes and continued seasonal strength set the stage for thin market catalysts to provoke outsized reactions.
Conclusion for Investors
Seasonal strength remains supportive, and broad indexes are near key technical thresholds. However, with catalysts light, and positioning and sentiment skewed, these will be the dominant drivers of risk assets. Investors should watch for volatility around the release windows, maintain risk discipline, and ensure risk exposures align with both technical signals and evolving macro expectations as markets transition into 2026.
More By This Author:
Copper Prices Surge To All Time HighsThe ECB Changes Tone: Will The Fed Follow?
2026 Market Outlook Based On Valuations


Comments
Log in or sign up to join the conversation.