
October NFP employment came in at 150K (below consensus 180K), private NFP at 99K (vs 158K consensus). Here’s the picture of business cycle indicators followed by the NBER’s BCDC, along with S&PGMI’s (nee Macroeconomic Advisers) monthly GDP:
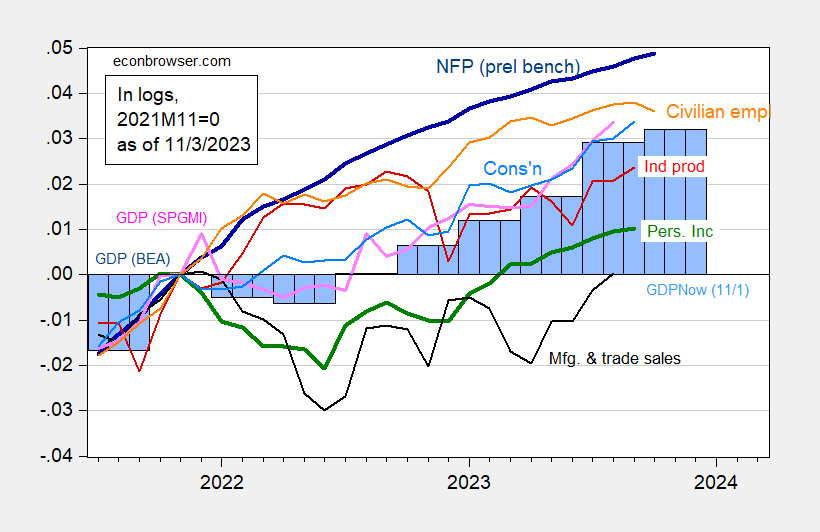
Figure 1: Nonfarm Payroll employment incorporating preliminary benchmark (dark blue), civilian employment (orange), industrial production (red), personal income excluding transfers in Ch.2017$ (green), manufacturing and trade sales in Ch.2017$ (black), consumption in Ch.2017$ (light blue), and monthly GDP in Ch.2017$ (pink), GDP (blue bars), all log normalized to 2021M11=0. Source: BLS via FRED, BLS preliminary benchmark, Federal Reserve, BEA 2023Q2 third release incorporating comprehensive revisions, S&P Global/IHS Markit (nee Macroeconomic Advisers, IHS Markit) (10/2/2023 release), Atlanta Fed (11/1/2023 release), and author’s calculations.
There is some thought that the civilian employment (CPS) series peaks before the CES nonfarm payroll employment series does. Over the last four recessions this has been true twice (using the data available at the time) [1]. So, the decline in the civilian employment might be taken as an indicator of recession, even if it does not predict economic actvity vere well.
Note that while civilian employment as measured by the CPS fell slightly, the employment series adjusted to the NFP concept rose in October. Here are the alternative series:
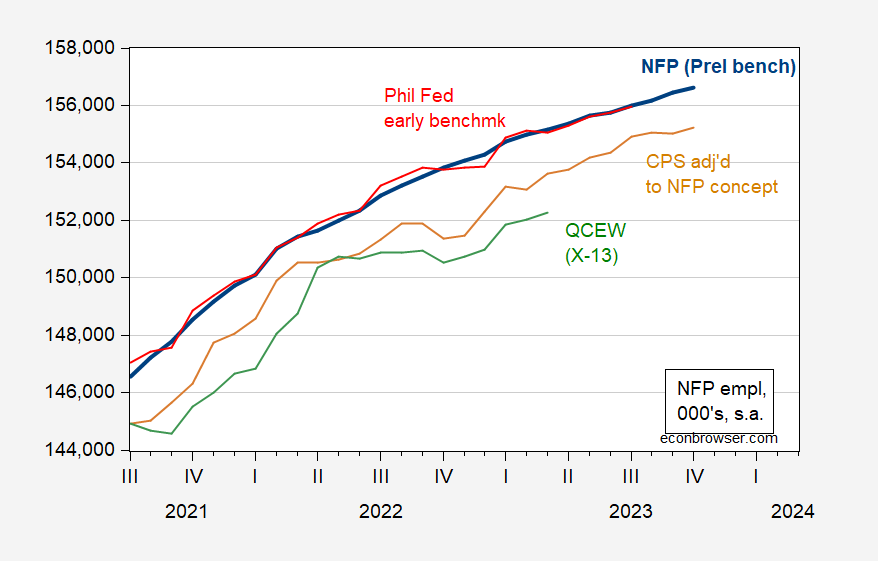
Figure 2: NFP employment incorporating preliminary benchmark calculated by author (bold blue), Philadelphia Fed early benchmark (red), household employment adjusted to conform to NFP concept (tan), and QCEW covered employment adjusted by Census X-13 by author (green), all in thousands, seasonally adjusted. Source: BLS via FRED, Philadelphia Fed, BLS, BLS-QCEW, and author’s calculations.
That being said, two indicators not followed by the NBER are suggestive. First the real-time Sahm Indicator.
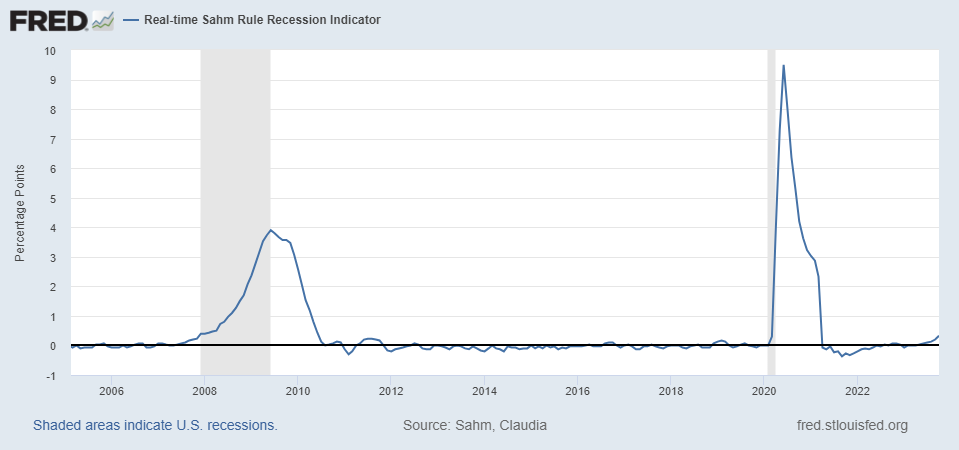
Source: FRED, accessed 11/3/2023.
The October reading is 0.33, where 0.50 is the threshold for a recession call.
Rashad Ahmed calls my attention to heavy truck sales. As I pointed out in this post, heavy truck sales are a pretty good coincident indicator of recessions (certainly more so than VMT or gasoline supplied).
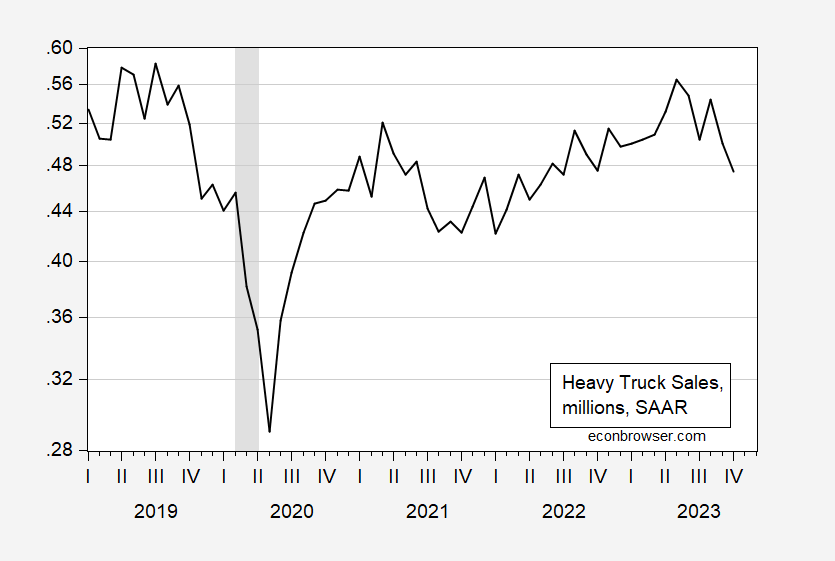
Figure 3: Heavy truck sales, in millions, SAAR (black). NBER defined peak-to-trough recession dates shaded gray. Source: Census via FRED, NBER.
Sales are down about 16% from the most recent peak in May. Year-on-year growth in sales is 0%. For now, the estimated probability for recession in October is 8%. By way of contrast, in the 2007 recession, the y/y change was about 30% when the recession started.
So, maybe no recession in October (although all variables weill be revised), but these two (coincident) indicators are moving in that direction.
More By This Author:
We Are In A Soft Recession Right NowNIPA-Based Alternative Measures Of Economic Welfare
Requiem For A Technocrat


Comments
Log in or sign up to join the conversation.