
These are the weekly charts of the Economic Modern Family.
We begin by featuring the original six.
We will then look at our 7th member, and end with a look at NASDAQ.
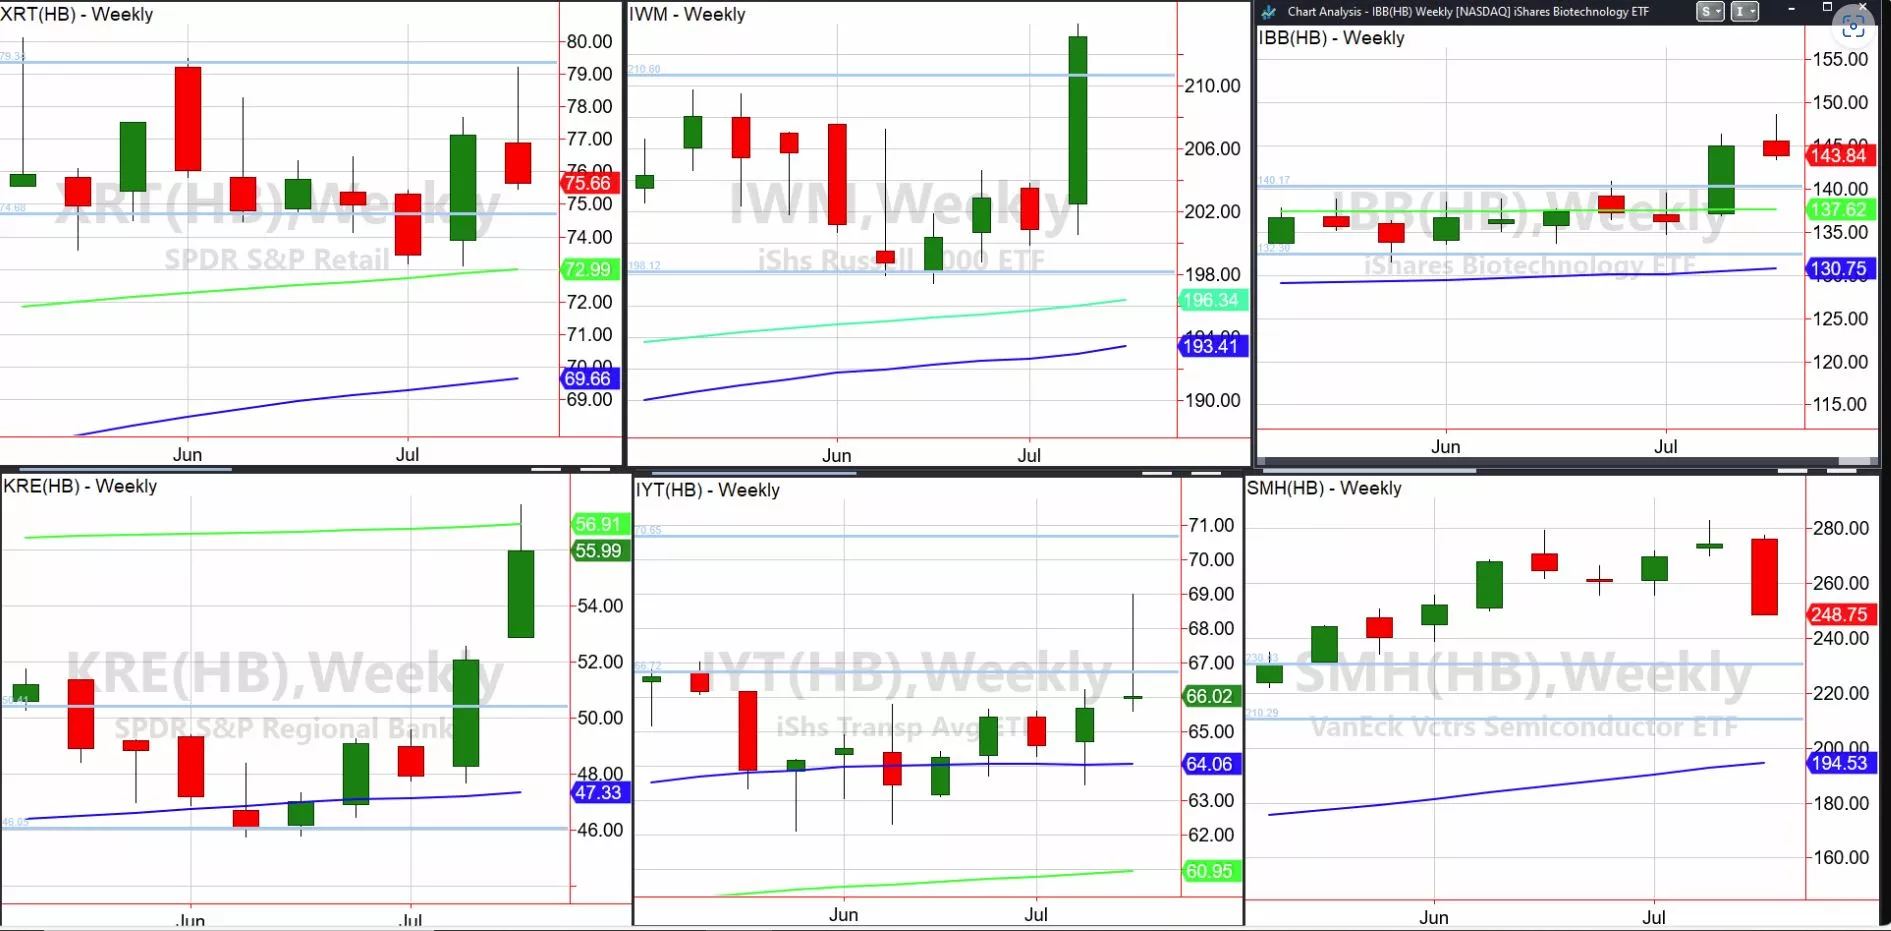
The weekly charts of the original Modern Family (Russell 2000 IWM, Retail XRT, Transportation IYT, Regional Banks KRE, Biotechnology IBB, and Semiconductors SMH), are all over the map.
Retail XRT began the week lower, then shot up to the top of the weekly channel (light blue). The bulls got excited.
Then, XRT sold off, not only failing the July 6-month calendar range high (featured in another Daily this past week), but also now looking confused.
The Russell 2000 IWM began the week good, then went great!
IWM sits right around the July 6-month calendar range high or 217.
And, it has cleared the weekly channel like above 212.
Gramps looks better than Granny-but its hard to commit to the old man when his wife is confused.
Then we have Biotechnology IBB. On the Daily chart it got overbought, However, we still like it provided it holds 140. And as a member of the Family, IBB can go rogue, up or down.
Semiconductors, SMH fell from grace. The week before, she was still Wonder Woman. This past week though, we have seen a key reversal top. Plus, momentum on the Daily chart is bearish. One week’s price action took out the last 4 weeks of price action. Not healthy.
Can she hold? The July 6-month calendar range low is at 260, so right now the odds are stacked against her.
Transportation IYT is more baffling. IYT trades under the July 6-month calendar range high on the Daily chart. We look at that as a reversal top.
Nonetheless, IYT has a textbook inverted hammer doji weekly price pattern.
We could argue that is forced selling or weak long liquidation. I’d keep the faith here especially if IYT can trade back above 67.00.
Regional Banks KRE took 9 months to clear the trading range between 45-50.
It was the week before this past one we saw KRE begin to take flight. Then, this week, with great follow through, look where our Prodigal Son stopped. Right at the 200-week moving average.
This remains the strongest sector for now, ironically, as KRE is above the July 6-month calendar range high.
KRE looks great over 54 and better over 57.
That’s six pairs of eyes all with different faces.
Let’s look at our newest member, Bitcoin.
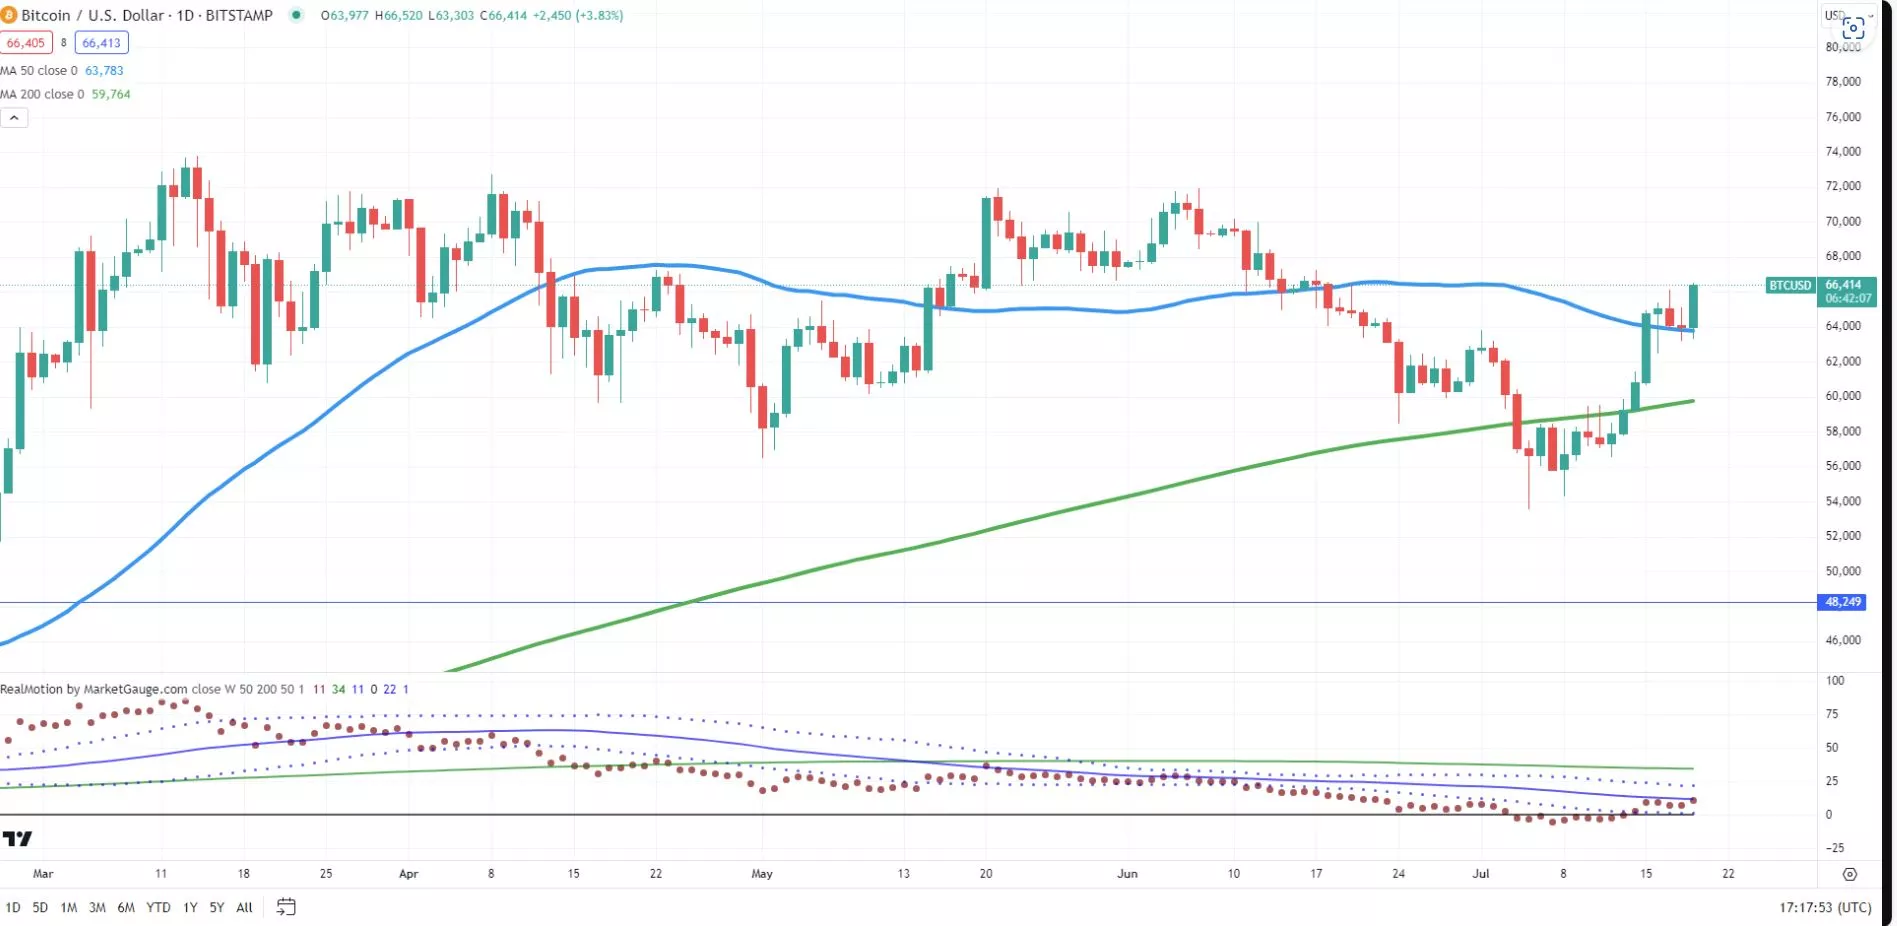
Bitcoin cleared the 50-DMA and went back into a bullish phase.
The momentum is now trying hard to clear the 50-DMA (by the red dots).
We have a long way to go to see momentum as strong as it was in March, but a push through 67,000 might be a good start.
The chart that is illustrated is a Daily chart.
BTCUSD also cleared July 6-month calendar range high and now has a good chunk of support between 62-64,000.
That makes Bitcoin and Regional Banks the most compelling as we enter a new week.
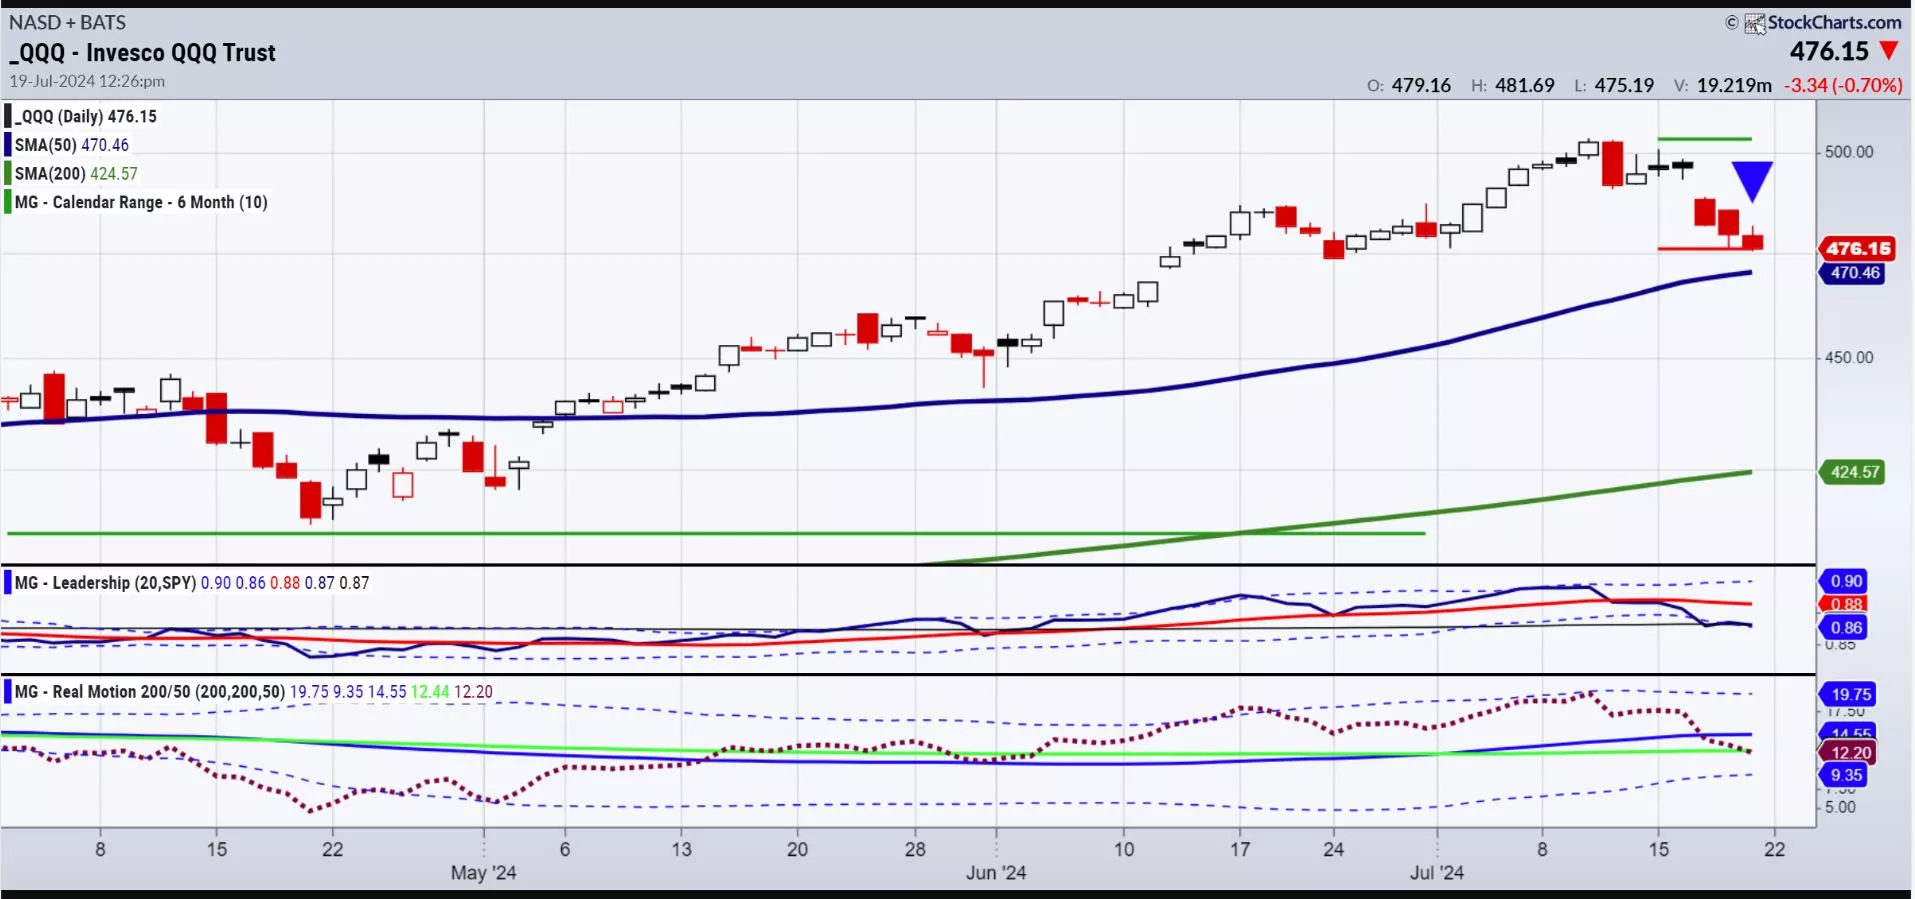
Leaving the Family for a moment, this is the Daily chart of NASDAQ 100.
Think about the 7 pairs of eyes looking at 7 different setups, then look at this, with a new set of eyes.
This is classic use of Stockcharts and MarketGauge’s ACP Plugins:
- July 6-mo calendar range-note that the low is breaking down.
- QQQ well underperforming the benchmark.
- Real Motion or momentum shows a significant bear divergence-breaking the 200 moving average while price is above.
Tells us-
- Patience is key as a break under 470 would not be pretty.
- Price has to hold over 476 and momentum has to clear back over the MAs to get bullish.
- We are not yet oversold.
This extraordinarily disjointed technical picture means that investors should respect the weaker seasonality.
And investors should respect the strong sectors from the weak and not overthink.
We have learned that regardless of political agendas during the campaign trail, the market craves certainty.
Agendas are not certain. And our upcoming elections are anything but certain.
More By This Author:
Hello July 6-Month Calendar RangeGranddad Russell 2000 Hurdles The July Calendar Range
Let’s Not Forget The Most Relevant Market Basics


Comments
Log in or sign up to join the conversation.