

Image Source: Unsplash
The S&P dropped 40 points this morning.
Norwegian Cruise Lines (NCLH) cratered 13% despite beating earnings.
Palantir (PLTR) got demolished.
UBER broke its algorithmic channel.
Even the dippers hesitated for the first time in months.
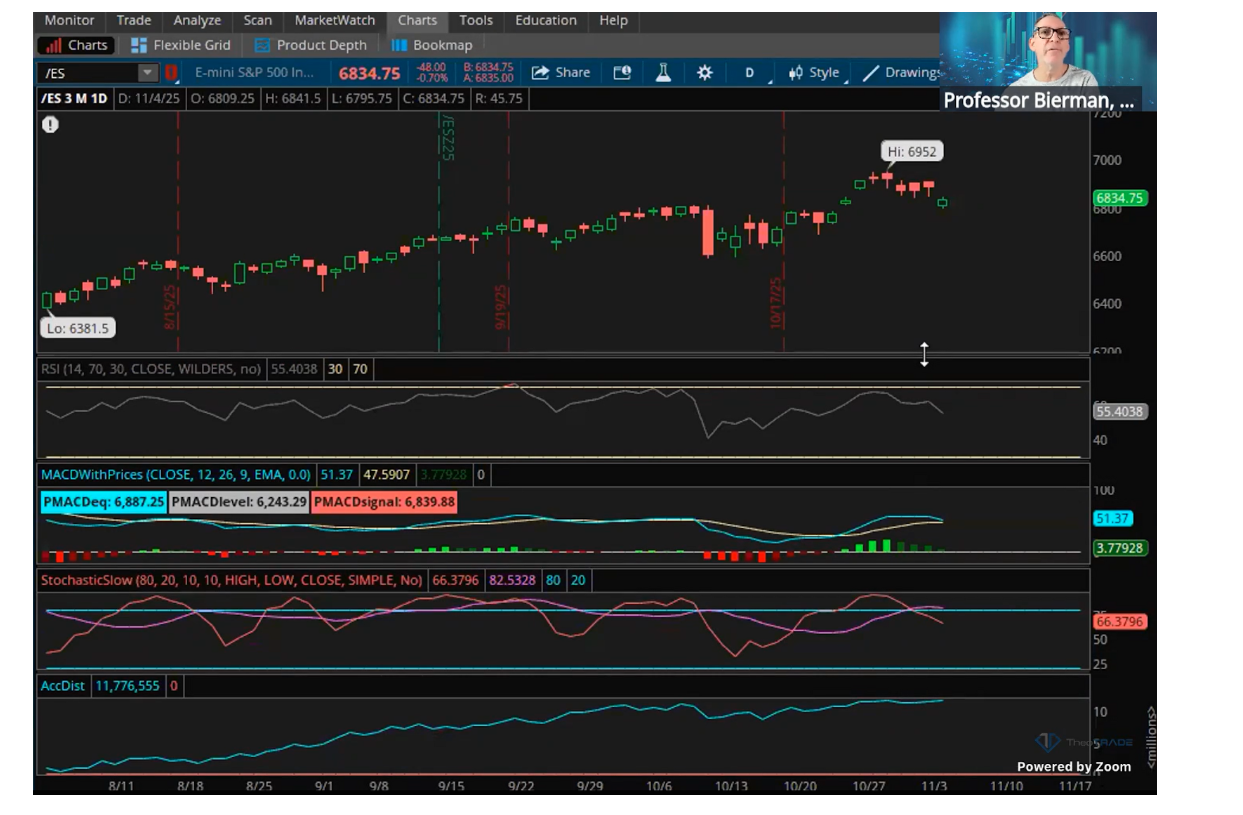
Every technical indicator on the daily chart flashed red. RSI rolled over. MACD crossed negative. Money flow reversed. The momentum that carried this market higher for seven straight months just hit a wall.
But here's what 99% of traders miss: momentum breaking doesn't mean trend is dead.
This distinction separates professionals who position ahead of major moves from retail traders who get whipsawed trying to trade every wiggle. Today's action perfectly demonstrates why understanding this difference will save your account when the real correction finally arrives.
The Genesis Cog Scanner tracks this exact inflection point in real time.
It identifies when momentum indicators break on shorter timeframes while weekly trend structure remains intact.
This is the most dangerous setup in markets because it traps both bulls and bears who don't understand what they're actually seeing.
Let me show you exactly what changed today and why it matters for the next three months.
Why Momentum Must Break Before Trend
Momentum measures velocity. Trend measures direction.
Think of it like Newton's law of physics. An object in motion tends to stay in motion unless acted upon by an opposing force. The market operates identically.
The S&P has climbed for seven months without a meaningful pullback. That's the trend. It's been one steady walk higher with almost zero consolidation. That trend continues until weekly indicators confirm the reversal.
But today's 40-point drop? That's momentum breaking. The velocity slowed. The rate of gains decelerated. Buyers hesitated. The force pushing prices higher weakened.
This happens in every major reversal. Momentum cracks first. The speed slows down before the direction changes. You run out of gas before the car stops moving.
(Click on image to enlarge)
The problem is most traders see momentum break and immediately assume trend is finished. They short aggressively. They panic sell longs. They trade like the correction already started.
Wrong. Dead wrong.
Momentum breaking tells you the inflection point is coming. It doesn't tell you the inflection point arrived. Those are completely different conditions requiring opposite positioning strategies.
What Today's Action Actually Revealed
Look at what happened across the market today.
Norwegian Cruise Lines beat earnings. The company delivered solid numbers. The stock dropped 13% anyway. Why? Because momentum broke before the earnings report. The chart was already rolling over. The beat didn't matter.
Uber broke its algorithmic channel after months of steady gains. The machines that defended every dip for 90 days stopped buying. The momentum died. But Uber's weekly chart hasn't confirmed a trend reversal yet.
Even the broader market showed this pattern. The S&P opened down. Every bounce attempt got sold. The dippers who've bought every 50-point drop for seven months hesitated. The momentum that made buying dips profitable just stopped working.
But check the weekly indicators. The MACD hasn't rolled over. The trend line remains intact. The slope still points up. Zero confirmation of an actual trend reversal.
(Click on image to enlarge)

This creates the most dangerous market condition that exists. Bulls think the trend continues and keep buying. Bears think momentum breaking means they should short aggressively. Both sides position for scenarios that haven't confirmed yet.
The reality is simpler. We're at an inflection point. Momentum broke but trend survives. What happens next determines whether you make money or get destroyed over the next three months.
The Three Conditions That Matter Now
When momentum breaks but trend remains intact, three outcomes are possible:
Momentum recovers and trend continues. The market consolidates briefly, rebuilds momentum on the daily timeframe, then resumes the uptrend. The weekly indicators never roll over. Bulls win. Shorts get squeezed. This happened dozens of times during the 2009-2020 bull market.
Momentum stays broken and grinds sideways. The market enters a trading range. Neither bulls nor bears get what they want. Prices chop between support and resistance for weeks while weekly momentum slowly deteriorates. This frustrates both sides equally until something finally breaks.
Momentum break becomes trend reversal. The weekly MACD crosses below its signal line. The slope turns negative. Volume expands on down days. The algorithmic sell program activates. This is when the real correction begins and accounts get destroyed.
You don't know which scenario plays out until weekly indicators confirm. That's the entire point. Momentum breaking on daily charts doesn't predict the future. It signals the inflection point has arrived.
Your job isn't guessing which outcome happens. Your job is positioning so you survive all three scenarios without getting destroyed by any of them.
How Professionals Trade This Setup
I'm 65% cash right now. Lowest long exposure I've held in years.
Why? Because I can't price the risk when momentum breaks but trend survives. I don't know if we consolidate here and resume higher or if this marks the top. Neither does anyone else regardless of what they claim.
Here's what I do know. If momentum stays broken and the weekly MACD rolls over, this market drops 10% minimum. Probably 15%. Maybe 20% if the decline accelerates. The algorithms that defended every dip for seven months will attack every bounce with identical precision.
That risk isn't worth whatever limited upside remains. Even if the market grinds 3-5% higher before correcting, that small gain doesn't justify the potential drawdown once trend actually breaks.
So I'm positioned defensively. Holding quality longs that work in any environment. Building selective shorts in stocks showing clear weekly breakdowns. Staying small on both sides. Waiting for confirmation before committing serious capital either direction.
The market handed you a gift today. It showed you momentum breaking in real time. It revealed the inflection point forming. It gave you time to adjust before trend actually reverses.
Most traders will ignore this warning because the weekly chart still looks bullish. They'll keep buying dips until the day the weekly MACD finally rolls over. Then they'll panic when systematic selling begins and realize they can't get out.
Don't be that trader. Momentum breaking is the early warning system. Use it.
The algorithms controlling 90% of daily volume calculate momentum breaks before they confirm on weekly timeframes. They identify these inflection points and position ahead of the trend reversal, not after price already collapsed.
The Genesis Cog Scanner reveals these same momentum shifts across the entire market simultaneously. It tracks when daily indicators break while weekly structure remains intact. It shows you exactly where we are in the cycle before the crowd figures it out.
When momentum breaks but trend survives, you're standing at the inflection point. The question is whether you'll recognize it or ignore it until it's too late.
More By This Author:
October Tells Me Exactly Where November Will Trade
Hidden Institutional Bets On Earnings Plays
Time To Start Giving Thanks To Tech

Comments
Log in or sign up to join the conversation.