

Image Source: Unsplash
Most traders look at charts and hope. I look at distributions and calculate.
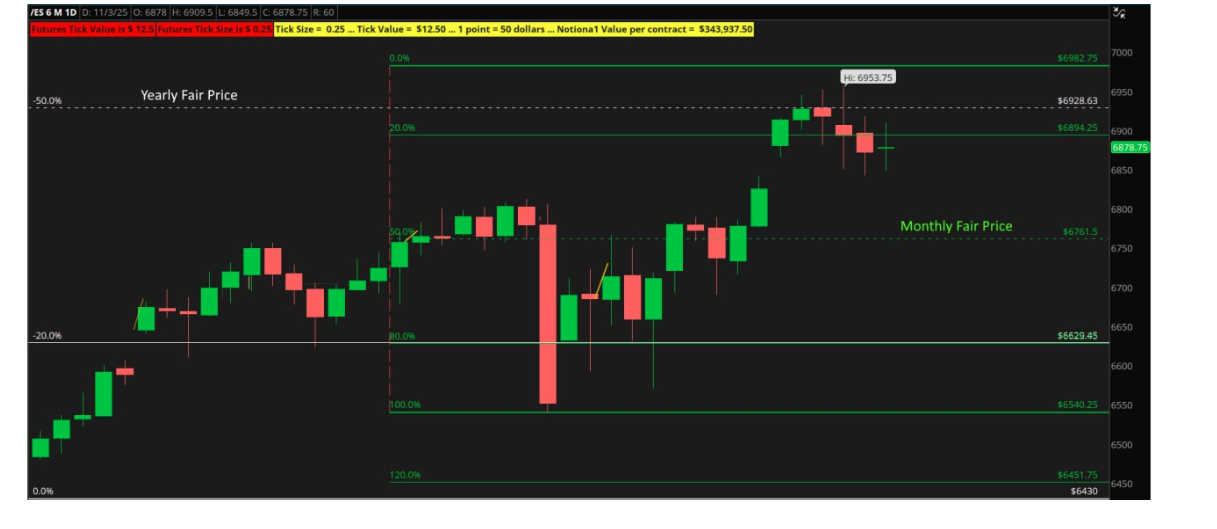
As November opens, I already know the S&P should trade between 6982 and 6540 for the entire month.
Not because of some mystical technical analysis, but because October's trading pattern mathematically projects November's range.
The Month-to-Month System
Last month's volume and time distribution creates this month's roadmap. It's mathematical projection based on how markets actually behave.
Take October's S&P action. When I run the monkey bars analysis - that's time-price-opportunity charts - October shows me perfect balance.
The high was 6953, the low was 6540. Fair price sits right at 6747. When markets are this balanced, they create predictable ranges for the following month.
Why This October Was Different
Most months, I run my automatic calculations and get clean projections. October was so perfectly balanced that my normal methodology gave me garbage levels.
When fair price and the 50% level align this closely, you're looking at a balanced market. October traded in a normal distribution curve. This almost never happens.
So I hand-drew November's levels. The math still works, but the skew was so tiny I needed manual adjustments.
November's Mathematical Targets
Based on October's balanced distribution, November should trade:
- Top: 6982 (overbought area)
- Fair price: 6761 (where we expect to return)
- Bottom: 6540 (oversold area)
This is October's volume and time distribution projected forward using standard mathematical principles.
The Balance Market Edge
When I see perfect balance like October showed, next month will likely trade a smaller range than normal. Balanced markets create compressed volatility in the following period.
Early November action supports this. The S&P is trading right near fair price, exactly where the math projects it should be.
Beyond the S&P
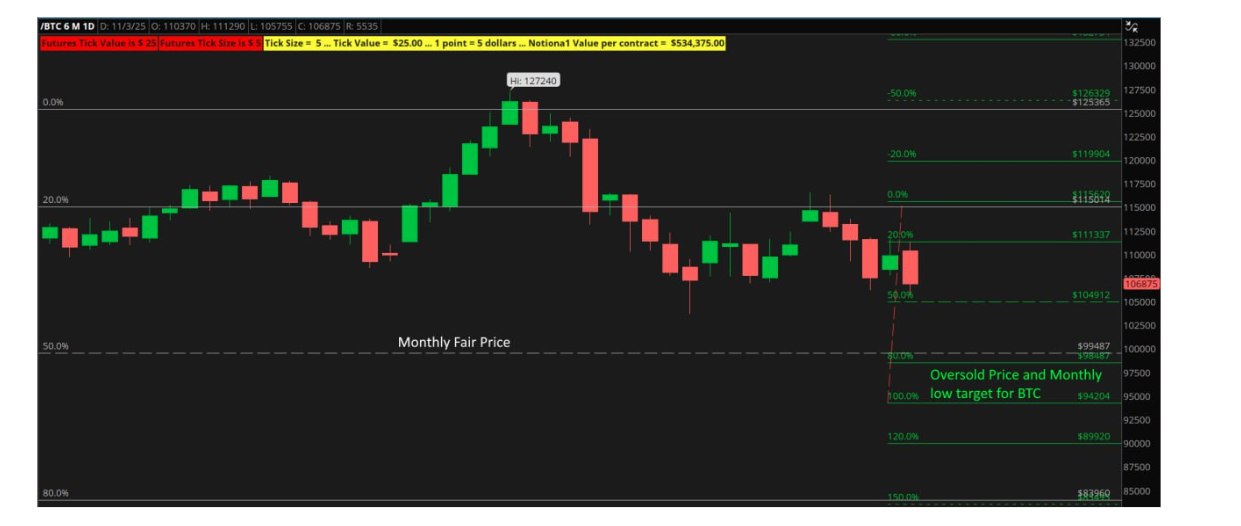
This system works across markets. Bitcoin's October distribution projects a November range of 11,500 down to 9,500, with fair price at 10,497. The Nasdaq shows similar mathematical precision.
Each market's October behavior tells me exactly where November should find support, resistance, and fair value.
The Real Edge
While everyone else is drawing lines and hoping for breakouts, I'm using mathematics to project where markets will actually trade. It's not about being right on direction - it's about knowing the probable boundaries.
October's perfect balance gives me November's roadmap.
The Bottom Line
Market prediction isn't mystical. It's mathematical. October's distribution creates November's probability map, and that map shows exactly where fair value sits.
Most traders guess. I calculate.
More By This Author:
Hidden Institutional Bets On Earnings PlaysTime To Start Giving Thanks To Tech
It’s Do-Or-Die Time For Crypto

Comments
Log in or sign up to join the conversation.