
More upbeat than WSJ April survey mean:
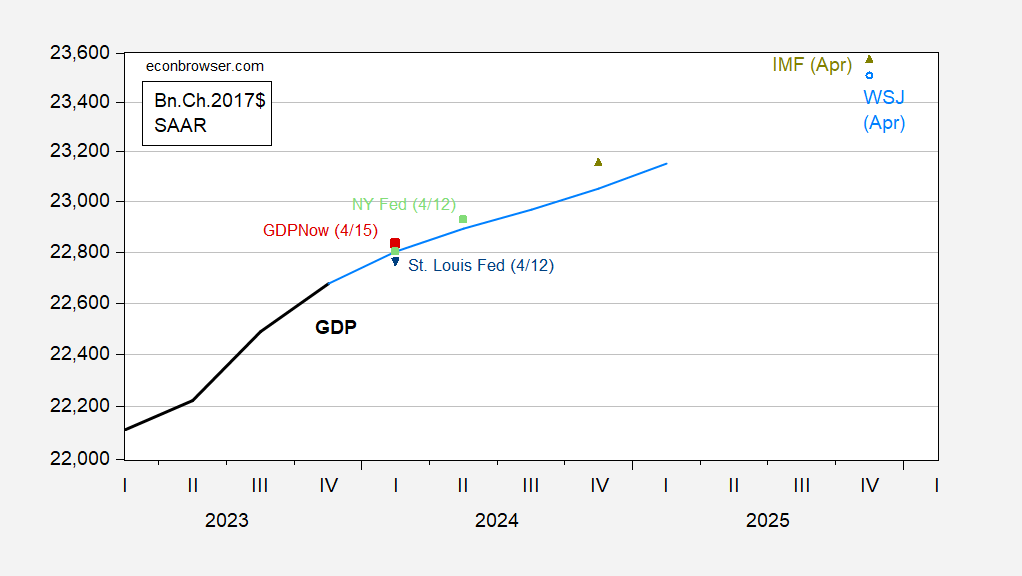
Figure 1: GDP (bold black), April WSJ survey (light blue), GDPNow (4/15) (red square), NY Fed (light green square), St. Louis Fed (blue inverted triangle), IMF April 2024 WEO (chartreuse triangles), all in bn.Ch.2017$ SAAR. Source BEA via FRED, Philadelphia Fed, Atlanta Fed, NY Fed, St. Louis Fed via FRED, IMF, and author’s calculations.
Below is the entire set of forecasts from the WEO, on a q4/q4 basis. Forecasts are based on the level of exchange rates prevailing in February 2024. See Table A1 of the data appendix of the WEO for assumptions.
2024 Q4/Q4 growth is a full 0.7 ppts higher than forecasted in the October 2023 WEO, and 0.6 ppts from the January WEO update. Euro area growth is marked down 0.1 ppts relative to January WEO update. China growth prospects were not marked down relative to January, although they are down 0.3 ppts relative to half a year ago.
(Click on image to enlarge)
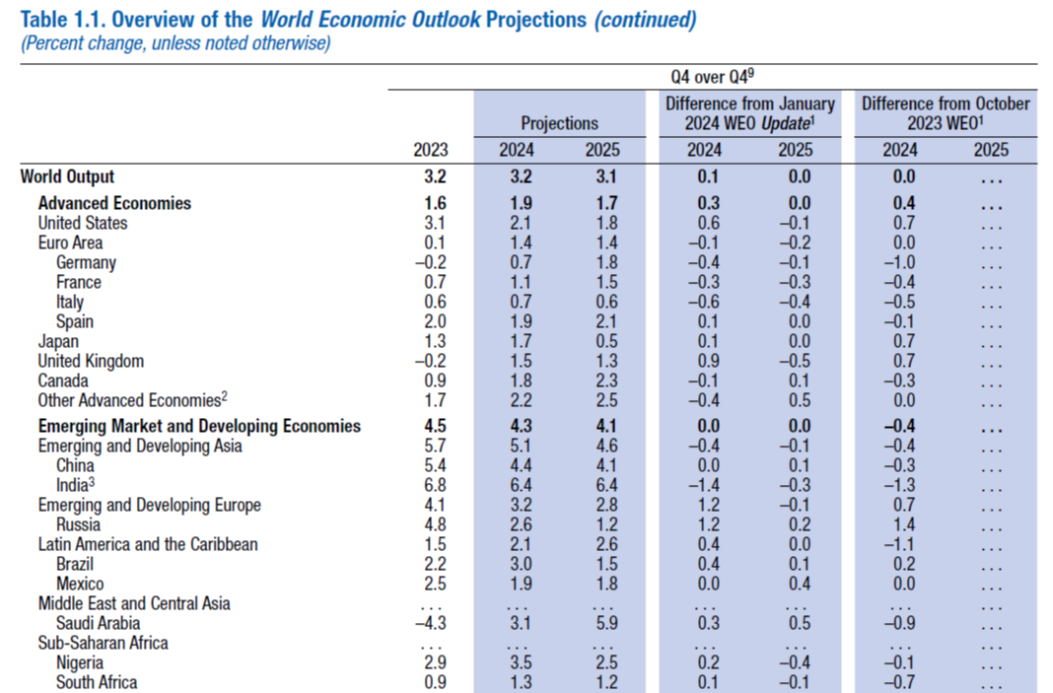
Source: WEO (April 2024).
From the WEO (p.xiii)
the global view can mask stark divergence across countries. The exceptional recent performance of the United States is certainly impressive and a major driver of global growth, but it reflects strong demand factors as well, including a fiscal stance that is out of line with long-term fiscal sustainability (see April 2024 Fiscal Monitor). This raises short-term risks to the disinflation process, as well as longer-term fiscal and financial stability risks for the global economy since it risks pushing up global funding costs. Something will have to give.
The IMF estimate of the 2024 output gap is +0.7 ppts. (compared to the US CBO estimate of essentially zero).
More By This Author:
GDP Forecasts Brighten Yet FurtherGDP Nowcasts - Sunday, April 14
Food Inflation Moderates


Comments
Log in or sign up to join the conversation.