
Atlanta Fed GDPNow at 4% q/q in Q4.
(Click on image to enlarge)

Figure 1: GDP as reported (black), WSJ October survey (red), GDPNow (tan square), and Goldman Sachs (green triangle), all in bn. Chained 2012$, SAAR. . Source: BEA 2022Q3 advance, WSJ, Atlanta Fed, Goldman Sachs (11/9/2022), and author’s calculations.
In the short term, the decline in reported GDP seems over. It’s important to recall that we will get a better read on GDP, and insight into GDO, with the next release at the end of November. For now, here are the other measures of GDP from the income side (GDI), and the average of expenditure and income sides (i.e., GDO).
(Click on image to enlarge)
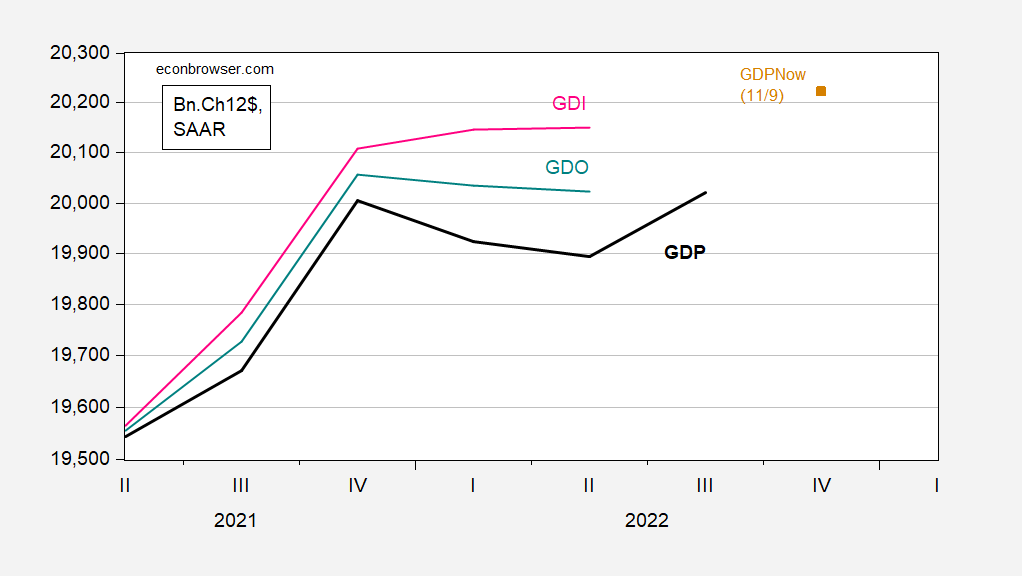
Figure 2: GDP as reported (black), GDPNow (tan square), GDI (pink), and GDO (teal), all in bn. Chained 2012$, SAAR. Source: BEA 2022Q3 advance, WSJ, Atlanta Fed, Goldman Sachs (11/9/2022), and author’s calculations.
More By This Author:
CPI Inflation Below Expectations – Markets RespondReal Median Weekly Earnings: CPI Vs. Chained CPI
Reminder: Using The “Two-Consecutive-Quarter Rule” There Is No 2001 Recession


Comments
Log in or sign up to join the conversation.