
The Enormous Earnings Power Of The Mag 7 Group

Image Source: Unsplash
The market loved the Amazon (AMZN - Free Report) and Alphabet (GOOGL - Free Report) results, was unimpressed by Microsoft (MSFT) numbers, and didn’t like Meta’s (META - Free Report) report. With Apple (AAPL - Free Report) and Tesla (TSLA - Free Report) results already in, we now have Q3 results from 6 members of the ‘Magnificent 7’ group.
The aggregate growth numbers for the group are impressive, with Q3 earnings on track to be up +26.7% from the same period last year on +17.6% higher revenues, which would follow the group’s +26.4% earnings growth on +15.5% revenue growth. Not all members of the elite group are equally contributing to the growth pace, ranging from Tesla’s -39.5% earnings decline in Q3 and Alphabet’s +33% jump.
The chart below shows the group’s blended Q3 earnings and revenue growth relative to what was achieved in the preceding period and what is expected in the coming three periods.
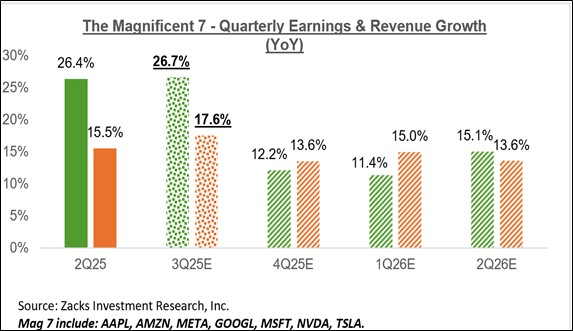
Image Source: Zacks Investment Research
Market participants appear to have found their peace with these companies’ ever-rising capex plans, particularly if management teams can show some tangible gain in their results. We saw that with Amazon and Alphabet, with both showing accelerating gains in their respective cloud businesses.
Microsoft had strong cloud revenue growth, up +26% from the same period last year and reflecting a modest downtick from the preceding period’s +27% growth pace. Guidance for the December quarter shows further growth deceleration, even though the period will have a relatively easier year-earlier comparison. Unlike this cloud deceleration, management indicated an accelerating capex spending trend in fiscal year 2026, which should help address the capacity issue that has been the primary driver of decelerating cloud revenue growth.
Unlike Amazon, Microsoft, and Alphabet, Meta can’t point to a specific business unit whose revenues are accelerating as a result of the spending growth. Market participants were disappointed with management’s raised guidance for 2026 capex and operating expenses, coupled with almost in-line revenue guidance for the December quarter.
The chart below shows the performance of Microsoft (up +23.1%), Meta (up +10.2%), Amazon (up +0.9%), and Alphabet (up +47.6%) relative to the Zacks Tech sector (up +30.1%) in the year-to-date period.
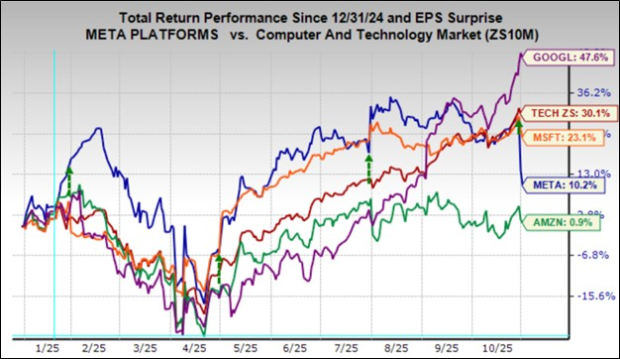
Image Source: Zacks Investment Research
The chart below shows the Mag 7 group’s earnings and revenue growth picture on an annual basis.
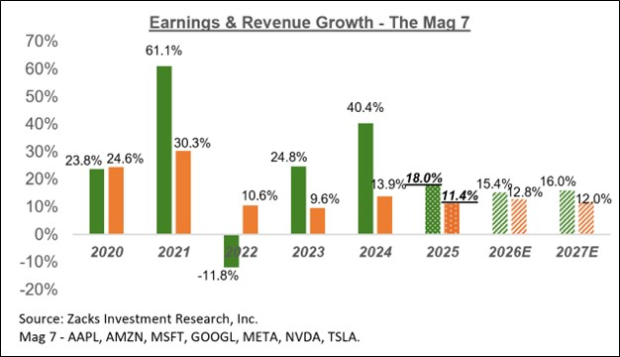
Image Source: Zacks Investment Research
Please note that the Mag 7 group is on track to bring in 24.9% of all S&P 500 earnings in 2025, up from 23.2% of the total in 2024 and 18.3% in 2023. Regarding market capitalization, the Mag 7 group currently carries a 35.4% weight in the index. If this group of mega-cap companies was a stand-alone sector, it would be the second biggest in the S&P 500 index, just behind the Technology sector at 45% and above the Finance sector at 12.6%.
Q3 Earnings Season Scorecard
Including all reports released through Friday, October 31st, we now have Q3 results from 318 S&P 500 members, or 63.6% of the index’s total membership. Total earnings for these companies are up +13.9% from the same period last year on +8.4% higher revenues, with 84.3% beating EPS estimates and 76.7% beating revenue estimates.
The comparison charts below put the Q3 earnings and revenue growth rates from these companies in a historical context.
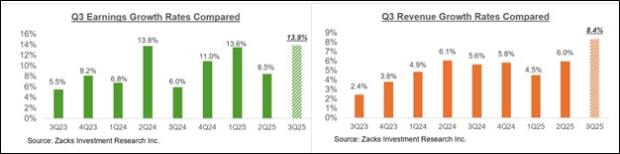
Image Source: Zacks Investment Research
The comparison charts below show the Q3 EPS and revenue beats percentages in a historical context.
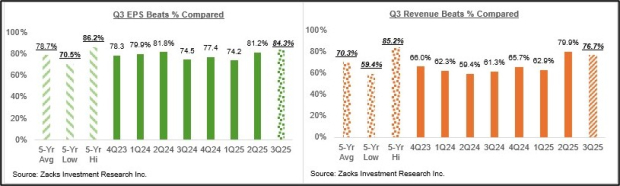
Image Source: Zacks Investment Research
For the Tech sector, we now have Q3 results for 62.1% of the sector’s market capitalization in the S&P 500 index. Total earnings for these Tech companies are up +22.6% from the same period last year on +12.6% higher revenues, with 95.1% beating EPS estimates and 85.4% beating revenue estimates.
The comparison charts below show the sector’s Q3 EPS and revenue beats percentages in a historical context.
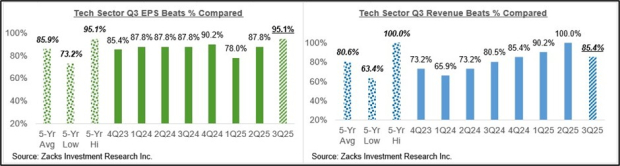
Image Source: Zacks Investment Research
The comparison charts below show the sector’s Q3 earnings and revenue growth rates in a historical context.
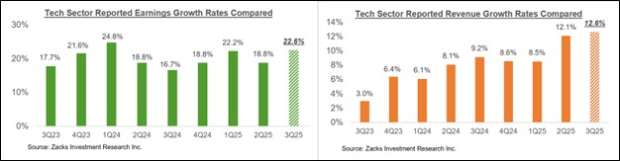
Image Source: Zacks Investment Research
The Earnings Big Picture
The chart below shows current Q3 earnings and revenue growth expectations for the S&P 500 index in the context of the preceding 4 quarters and the coming four quarters.
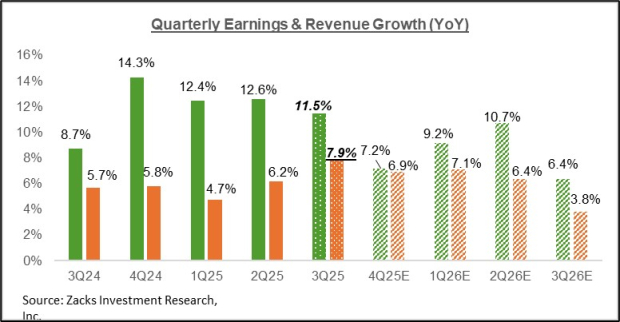
Image Source: Zacks Investment Research
Please note that the +11.5% earnings growth rate for Q3 shown above represents the blended growth rate for the quarter, which combines the actual results for the 318 companies that have reported with estimates for the still-to-come companies.
The chart below shows the overall earnings picture on a calendar-year basis.
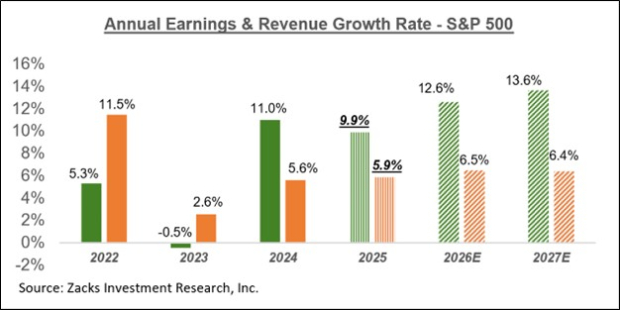
Image Source: Zacks Investment Research
In terms of S&P 500 index ‘EPS’, these growth rates approximate to $258.80 for 2025 and $291.46 for 2026.
More By This Author:
Positive Picture Emerging From Q3 Earnings Season
Previewing Mag 7 Earnings: What Investors Should Know
Finance Sector Provides Flying Start To Q3 Earnings Season


