
JOLTS data indicates the vacancies to unemployed ratio has descended to unity.
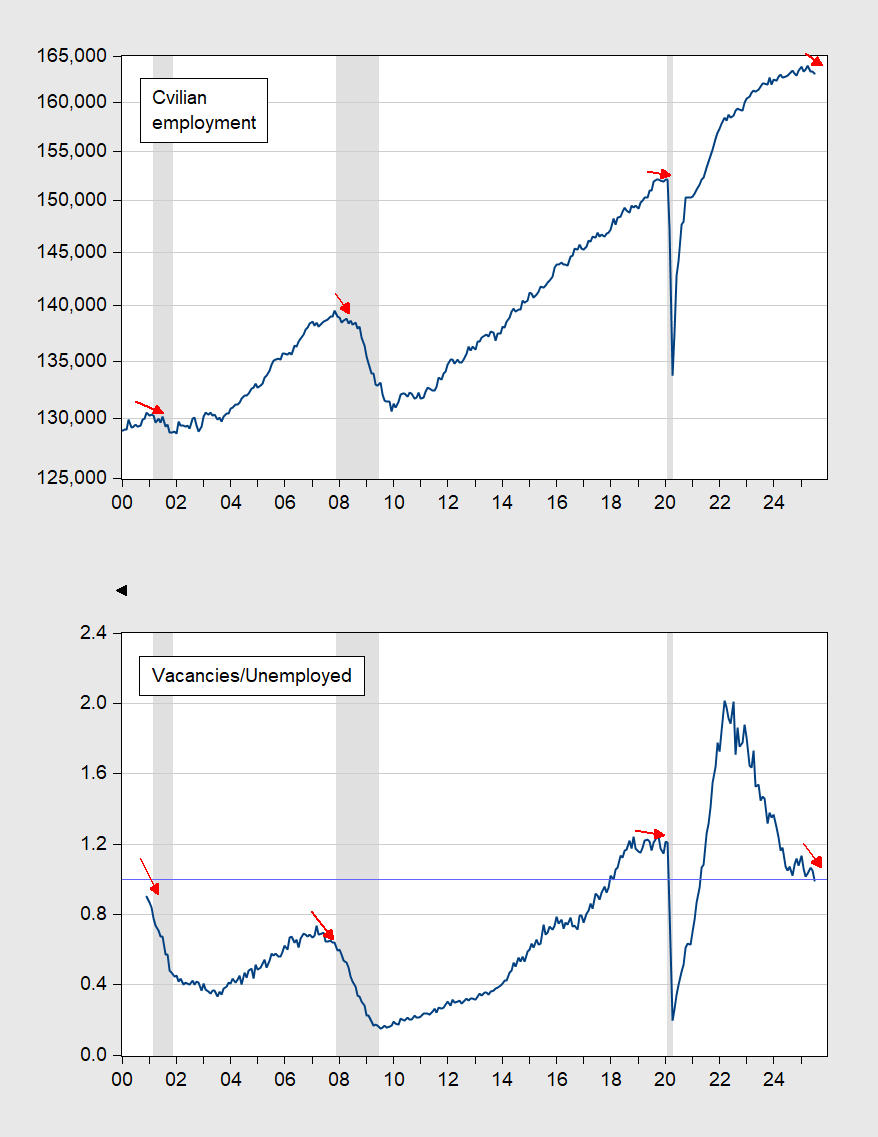
Figure 1: Top panel: Civilian employment (experimental series), 000’s, s.a. (blue line, log scale). Bottom panel: Vacancies to Unemployed Ratio (blue line). Horizontal light blue line at 1.0 value. NBER defined peak to trough recession dates shaded gray. Source: BLS, NBER, and author’s calculations.
The vacancies to unemployed ratio is declining to unity; while it has been lower in the past before a recession (before the 2001 and 2007-09 recessions) without going into a recession (bottom panel), it’s not done so without at the same time declining overall total civilian employment (top panel).
Relatedly, the vacancies-unemployed ratio was declining from 2022 onward, but concurrent employment growth was positive. That is no longer the case.
Finally, what does the ADP release tell us today? The net increase of 54K was less than the consensus of 64K. First, employment growth is decelerating, and small firm employment is showing a more marked deceleration — with August levels below prior peak.
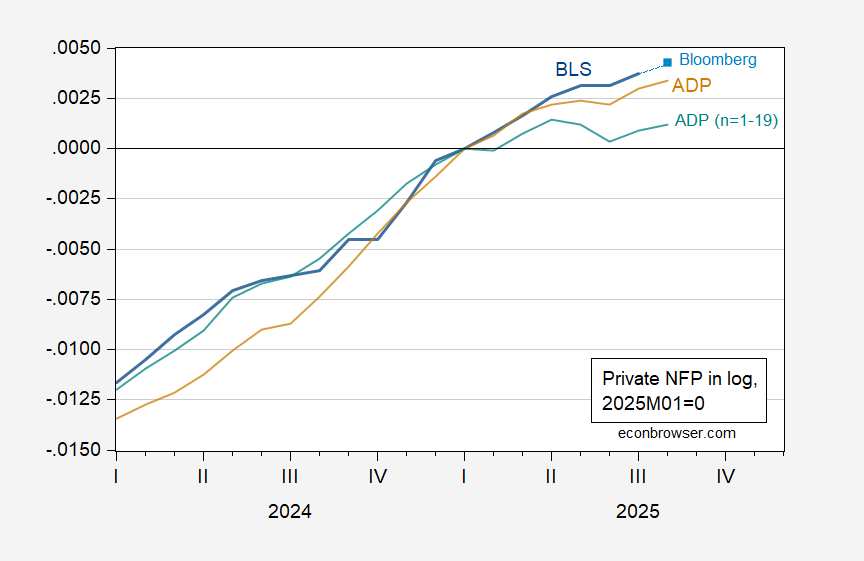
Figure 2: BLS/CES private nonfarm payroll employment (blue), Bloomberg consensus (light blue square), ADP private nonfarm payroll employment (tan), and ADP private NFP for firms 1-19 (teal), in logs, 2025M01=0. Source: BLS, ADP via FRED, Bloomberg, and author’s calculations.
Note that according to ADP estimates, small firm (n=1-19 employees) employment constitutes 26% of total. If one believes in pecking order credit models, slowdowns should show up in small firms.
More By This Author:
The Financial System: Some GraphsNowcasted “Core GDP” Decelerates
It Can’t Happen Here: Inflation Edition


Comments
Log in or sign up to join the conversation.