The Deflators
Aside from the monthly jobs report, at this time imo the most important economic data will be issued this Friday: namely, real personal income and spending, the deflators of which also figure in the calculation of real manufacturing and trade sales. That’s because, while real *consumer* spending of goods has been flat to declining for a year, and manufacturing production has been flagging, real personal consumption of *services* has been running historically hot, while producer price deflation has helped buoy *producer* sales.
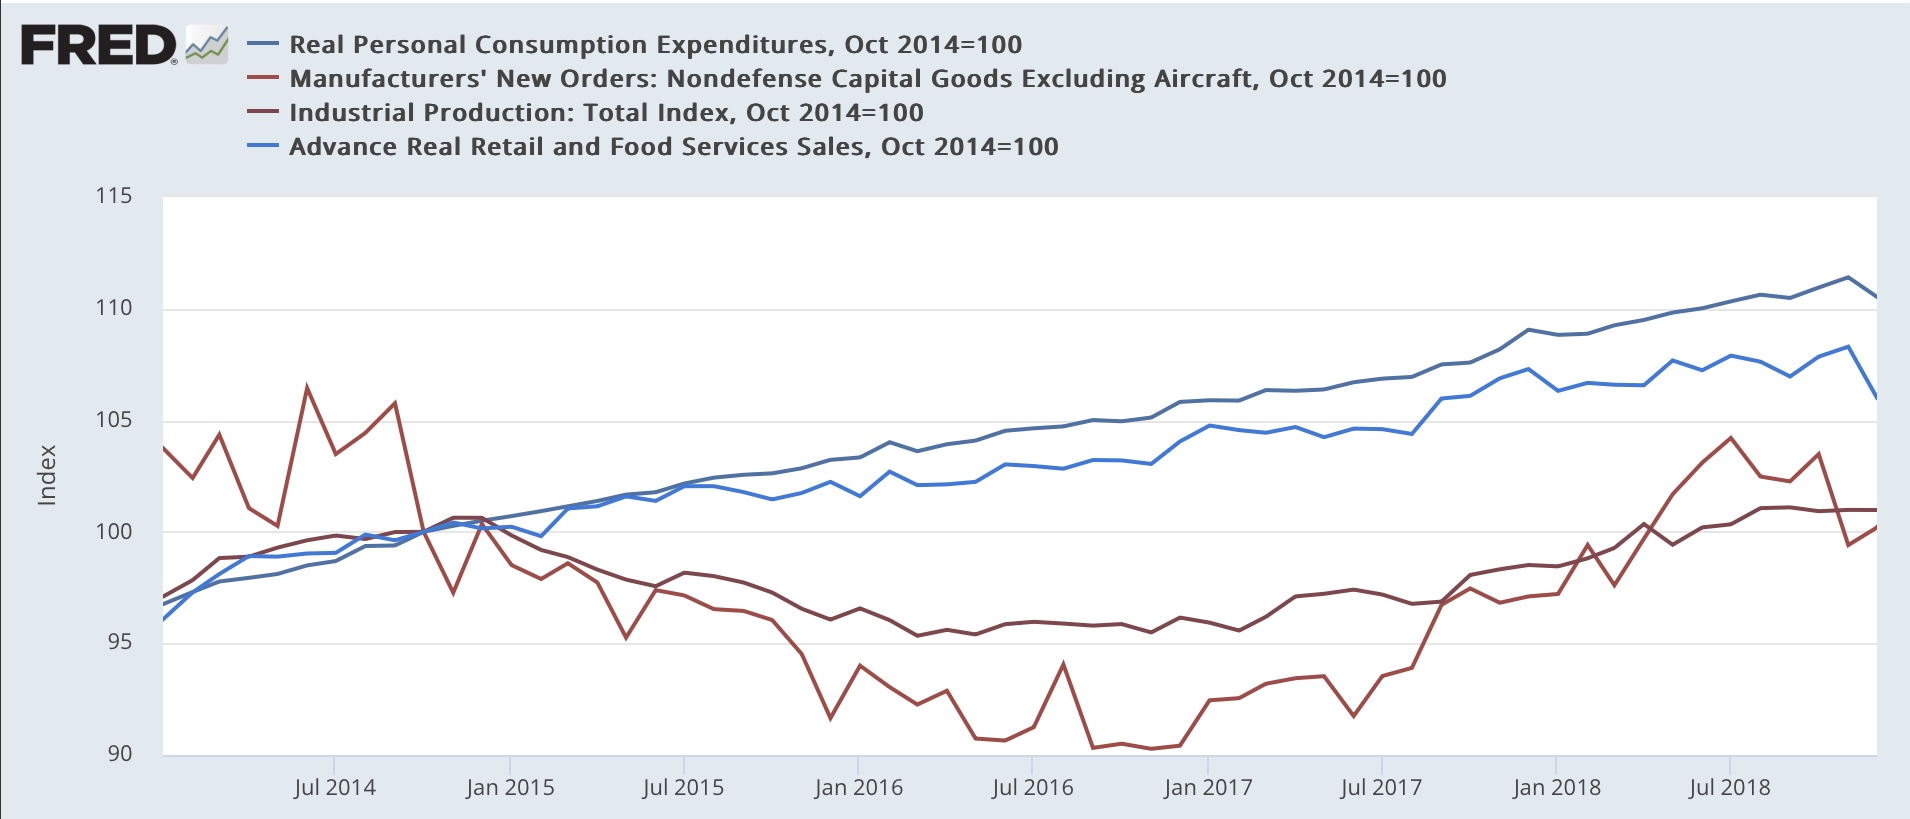
Let’s start with a follow-up on my note on durable goods orders. I pointed out that in 2015-16 there was a “shallow industrial recession” which never brought down the economy as a whole. That’s because, while durable goods orders (bright red) and industrial production (dark red) both declined 10% or more during that period, consumer spending as measured by both real retail sales (light blue) and real personal consumption expenditures (dark blue) sailed right along:
(Click on image to enlarge)

Let’s compare that to our post-pandemic period. For roughly the past 18 months, both real retail sales have been flat or even slightly declining, both industrial production and durable goods spending have only in the past six months done the same. Meanwhile real personal consumption expenditures have continued to improve:
(Click on image to enlarge)

Further dissection of personal consumption expenditures shows that *nominal* expenditures for goods has historically tracked very closely with *nominal* retail sales:
(Click on image to enlarge)

But the deflators for the two series are different, as a result of which *real* retail sales have not performed nearly as well as *real* personal consumption expenditures for goods:
(Click on image to enlarge)

Further, historically both real retail sales and real personal consumption expenditures for goods have turned down YoY both earlier and more deeply than real personal consumption expenditures for services (gold):
(Click on image to enlarge)

The same graph since the pandemic recession shows that YoY spending on goods is flat to declining in both series, while YoY real spending on services is still a historically robust 3%:
(Click on image to enlarge)

Finally, it’s worth pointing out again that personal saving tends to increase just before recessions, as consumers grow more cautious:
(Click on image to enlarge)

Note that this has already occurred in the past 6 months:
To return to my main theme, what has been so important about the reports on real personal spending and real manufacturing and trade sales is that (1) the deflators are more favorable to growth than in other “real” series; and (2) in particular, real spending on services has barely flagged at all.
On Friday I will be paying particular attention to whether or not this pattern continues, or whether real sales and real consumption at last turn down, and whether real consumption on services in particular decelerates significantly or not.
More By This Author:
Four Week Average Of Initial Claims Drops Below “Yellow Flag” Level, For NowTransportation Orders Increase, But Core Capital Goods Orders Decline Further In March
March New Home Sales Report
Disclaimer: This blog contains opinions and observations. It is not professional advice in any way, shape or form and should not be construed that way. In other words, buyer beware.


