The Canadian Dollar Slips On An Oil-Slicked November GDP Report
It is never good to see a negative print on a GDP growth number. It is even worse when it is below market “expectations.”
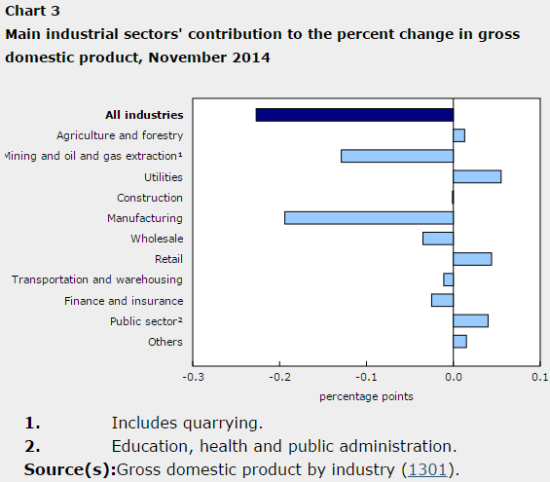
When Statistics Canada reported a GDP decline of 0.2% from October to November, the print came in below expectations for a flat report. What I am sure stuck out the most was the negative performance of mining and oil and gas extraction.

Manufacturing and mining and oil and gas extraction swing November’s GDP growth into negative territory
Source: Statistics Canada
It looks like the long-feared economic decline of Canada’s oil patch has begun.
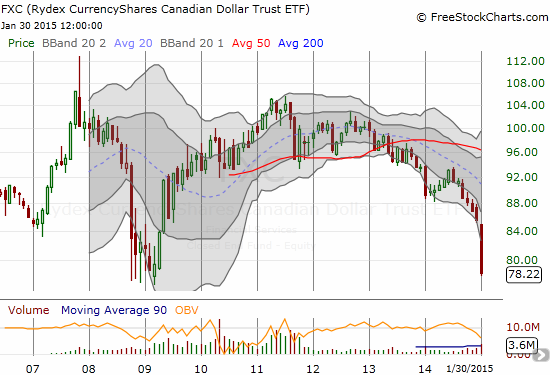
The reaction in currency markets was dramatic and underlined the fresh fear that the Canadian dollar’s weakness still has plenty of room to run. For the third day in a row, the Canadian dollar lost significant ground to the U.S. dollar. The monthly chart below shows that CurrencyShares Canadian Dollar ETF (FXC) has almost returned to 2009 levels.

CurrencyShares Canadian Dollar ETF (FXC) drops for the fifth straight month and six out of the last seven as the downtrend from 2011’s peak continues
Source: FreeStockCharts.com
Normally, this kind of retest would get me interested in trying a buy. In THIS case, I am lot more cautious. The downward trend in the Canadian dollar has lasted longer and extended further than even my most bearish assessments from 2013 to 2014. {snip}
Be careful out there!
Full disclosure: long USD/CAD


If you think Canuckistan is bad, check out Australia! Anything with any exposure to commodities is being taken to the woodshed. Hell, even Greece looks better than these poor slobs.
This is actually an old article that TalkMarkets accidentally republished from my site. But yes, the entire commodity complex is in collapse mode now!
This actually appeared on Dr. Duru's site here drduru.com/.../the-canadian-dollar-slips-on-an-oil-slicked-november-gdp-report/ dated July 22.