
Technically Speaking: The “Walking Dead” Market – 3000 Or 1500?

In May of last year, I wrote a blog post debating the likely path of the market through 2019. To wit:
“The chart below is a Fibonacci retracement/extension chart of the S&P 500. I have projected both a 123.6% advance from the 2009 lows as well as a standard 50% retracement using historical weekly price movements.”
(Click on image to enlarge)
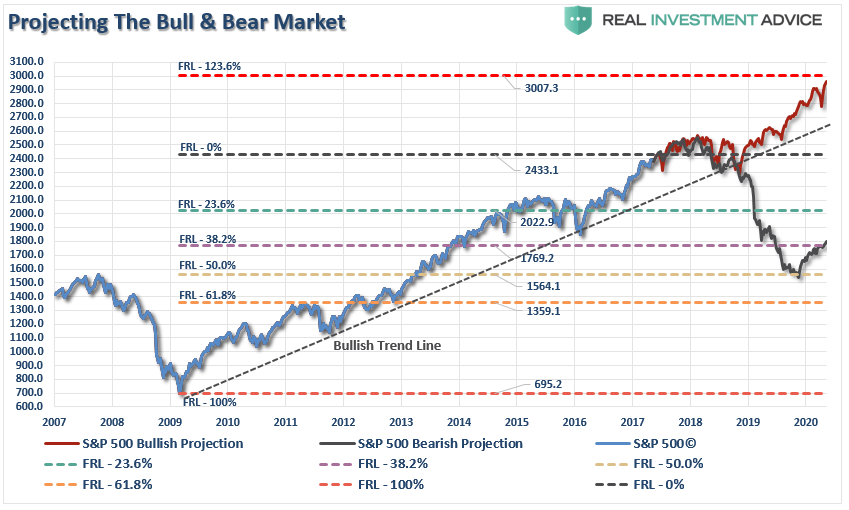
From the bullish perspective, a run to 3000, after a brief consolidation following an initial surge to 2500, is a distinct possibility. Such an advance is predicated on earnings and economic growth rates accelerating with tax cuts/reform being passed.
However, given the length of the economic and market cycle, there is a significant bear case being built which entails a pullback to 1543. Such a decline, while well within historical norms, would wipe out all gains going back to 2014.”
Since that time, tax cuts/reform have been passed, earnings estimates have exploded higher, and corporate stock buybacks have surged to record levels while wage growth has remained non-existent for the bottom 80% of workers.
Not surprisingly, with those tailwinds, the market has pushed sharply higher towards our original target of 3000.
(Click on image to enlarge)
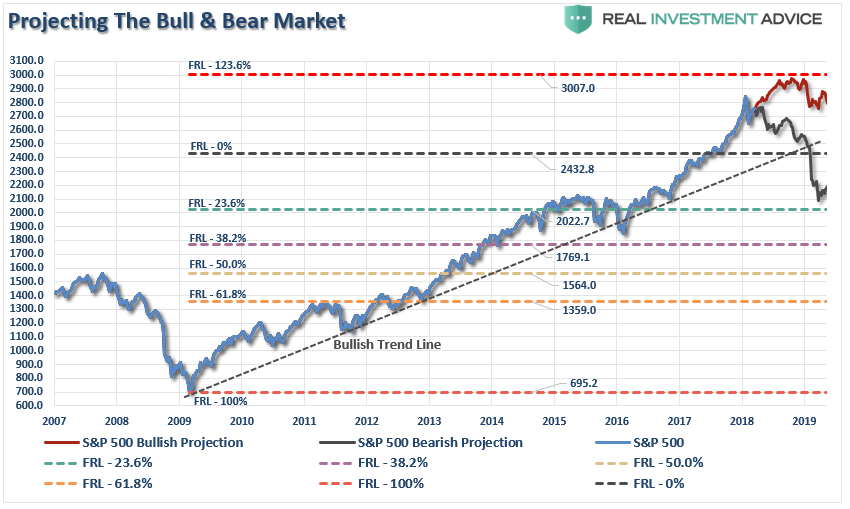
Currently, the pathway that target remains intact along with the longer-term bullish trend. However, the risk of a deeper correction, particularly given the signs of current economic weakness and weaker than anticipated revenue growth, continues to prevail.
Let me repeat, for those who may be “hard of reading,” the bullish trend remains intact and corrections should remain confined to the bullish trend for now which has been the case since 2009.
(Click on image to enlarge)
From the bullish perspective, a run to 3000, assuming the current consolidation completes successfully, is still a possibility as I detailed in last weekend’s missive:
“While I gave option (1) the greatest odds, it was option (2) that came to fruition as shown in the updated chart below.”
Chart updated through Monday
(Click on image to enlarge)
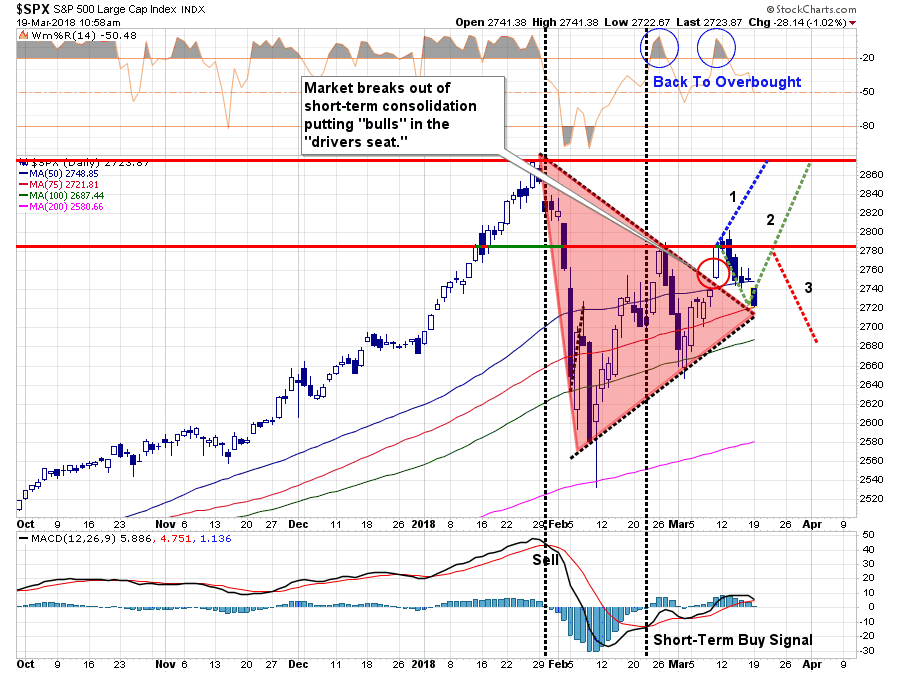
“The predicted path of decline, so far, has held at the 50-dma, which is bullish. However, the overbought condition, combined with the previous resistance level, proved too formidable for investors to push the market higher.”
On Monday the market broke back through the 50-dma and retested the top of the downtrend line which coincides with the 75-dma. Importantly, the short-term “buy signal” is threatening to reverse which could provide further selling pressure if it occurs.
This breakdown on Monday has not yet completely broken the “bullish case” for the market yet, however, a failed rally from current levels will bring “Option 3” into focus.
With the recent failure at the previous resistance level, we can now adjust our consolidation process for the market.
(Click on image to enlarge)
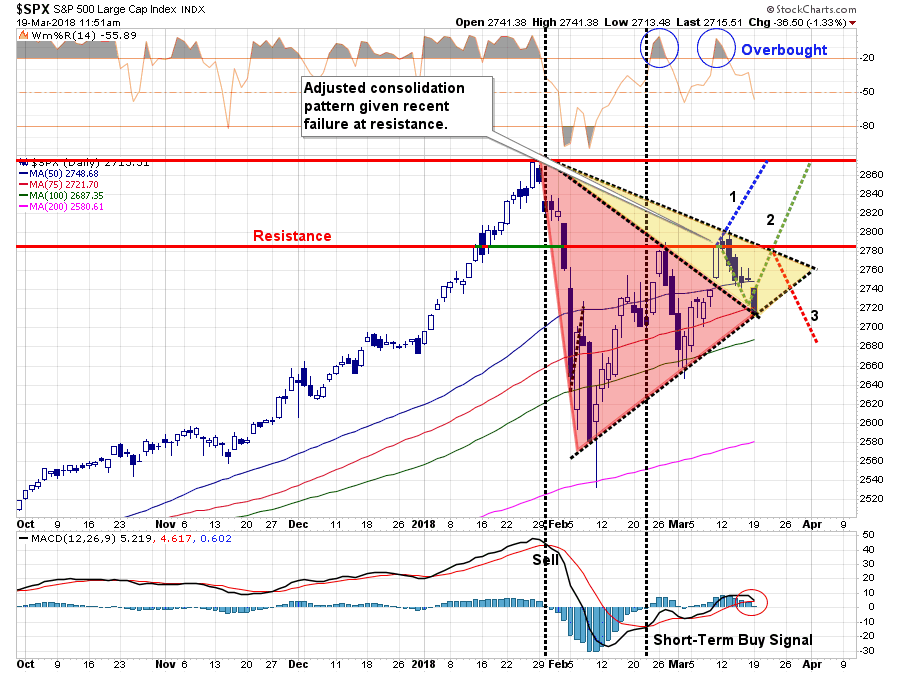
As long as the pattern of “higher lows” remains, a breakout above the current downtrend line and resistance should signal a move to old highs and the current 2018 target of 3000.
However, a break below the uptrend line will confirm a change to the current market and will require a shift in allocations to a more neutral stance.
We are potentially at a very critical juncture of this particular “bull market cycle,” and as Doug Kass noted yesterday:
“I expect a 2018 trading range of 2200-2850 – with a ‘fair market value’ (based on higher interest rates, disappointing economic and corporate profit growth, political and geopolitical uncertainties) of approximately 2400.
Compared to the expected trading range, downside risk relative to upside reward is approximately 5x.
Against ‘fair market value’ (based on my probability distribution of a host of independent variables – interest rates, inflation, corporate profits, economic growth, valuations, etc.) downside risk relative to upside reward is about 3x.”
I agree.
Risk/Reward Not Rewarding
My numbers are a little different than Doug’s but the premise is the same.
Given the length of the economic and market cycle, there is a significant bear case being built which entails a pullback towards the 2100 level. Such a decline, while well within historical norms, would wipe out all gains going back to 2015.
Just for the mathematically challenged, this is NOT a good risk/reward ratio.
- 3000 – 2733 (as of Monday’s close) = 267 Points Of Potential Reward
- 2733 – 2100 = -633 Points Of Potential Loss
With a 1.6 to 1 risk/reward ratio, the potential for losses is far more damaging to your long-term investment goals than the gains available from here.
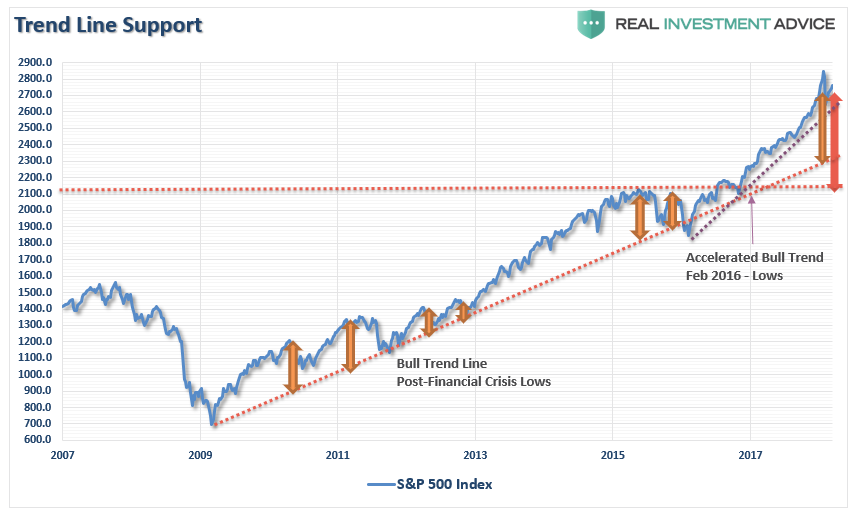
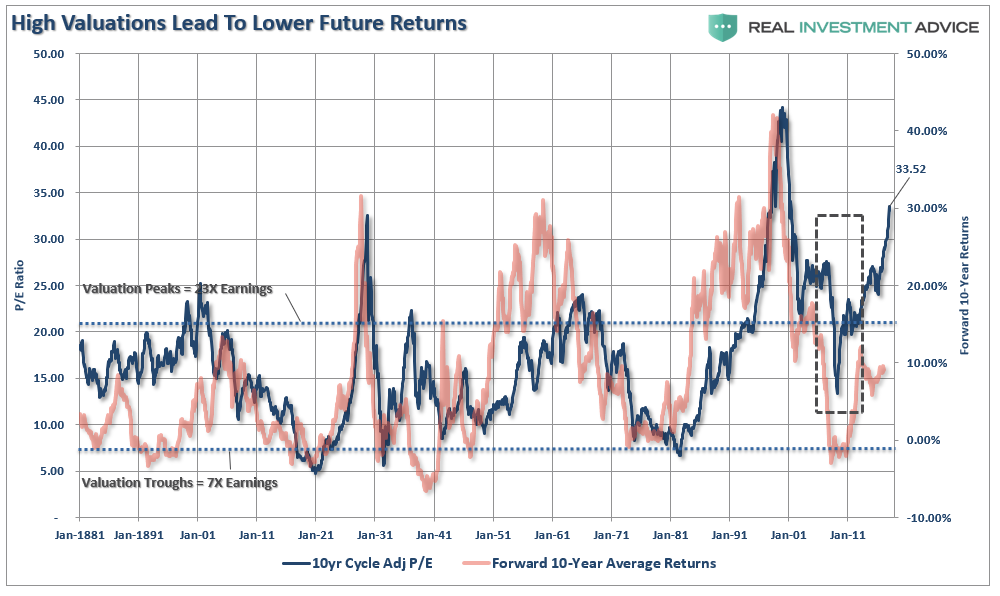
Moreover, the bearish case is also well supported by the technical dynamics of the market going back to the 1920’s. (The red lines denote levels that have marked previous bull market peaks.)
(Click on image to enlarge)

It is important to note that a full “mean-reverting event,” which has occurred numerous times throughout history will currently wipe out all stock market gains going back to 2000.
For investors planning on retirement, this eventual reality will devastate those goals. It will also correspond with the often repeated warnings of current stock market valuations (which are repeatedly scoffed out by the mainstream media.)
“What drives stock prices (long-term) is the value of what you pay today for a future share of the company’s earnings in the future. Simply put – ‘it’s valuations, stupid.’
That’s banal, I know, but everyone seems to forget it. And it means equity returns depend on how much you pay for their future profits, not on how much price volatility you can endure.”
(Click on image to enlarge)
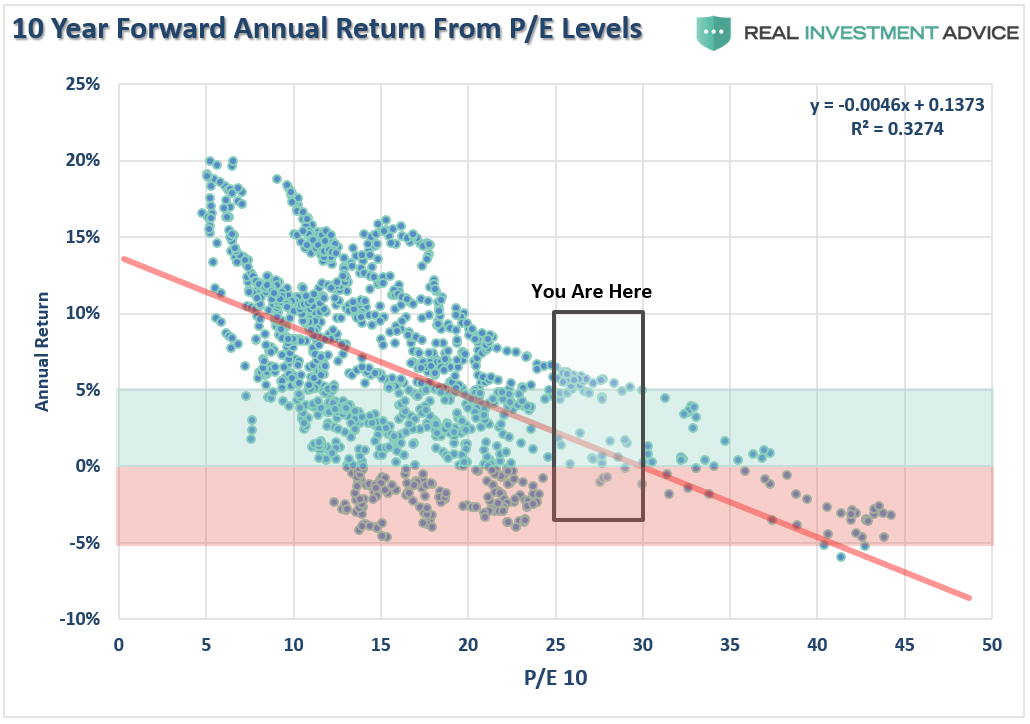
“With valuations at levels that have historically been coincident with the end, rather than the beginning, of bull markets, the expectation of future returns should be adjusted lower. This expectation is supported in the chart below which compares valuations to forward 10-year market returns.”
(Click on image to enlarge)
“The function of math is pretty simple – the more you pay, the less you get.”
Whether Doug’s numbers are correct, or mine, it will make little difference. The simple fact is that all “bull markets”do end.
The difference is identifying and reacting to the change when, not if, it occurs which is what will separate “Survivors”from the “Walking Dead.”
Yes, a breakout and a move higher is certainly viable in the “riskless” environment believed to exist currently.
However, without a sharp improvement in the underlying fundamental and economic backdrop, the risk of failure is rising sharply. Unfortunately, there is little evidence of such a rapid improvement is in the making.
There are two laws of physics worth remembering:
- What goes up…must come down, and;
- Gravity is a bitch.
Disclosure: The information contained in this article should not be construed as financial or investment advice on any subject matter. Real Investment Advice is expressly disclaims all liability in ...
more

