
Technically Speaking: FOMO Overrides FOLM

In this past weekend’s missive, I stated:
“The good news is the break above the 61.8% retracement level, as we noted last week, keeps the markets intact (Pathway #1) for now. And, as suggested above, a retest of recent June highs seems very likely. However, Monday will be key to see if we get some follow through from Friday’s close.”
Well, on Monday, the markets did indeed follow through and rose towards a retest of June highs.
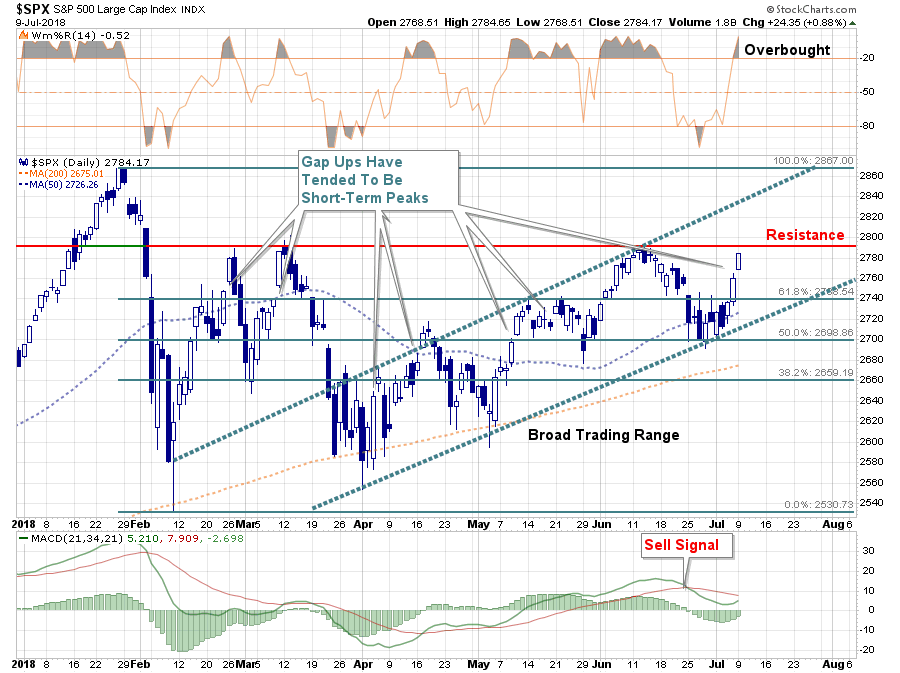
With the markets now back to a short-term overbought extreme, the June highs may be a challenge for the bulls in the short-term. Also, it is worth noting that since the beginning of this year “gap up” openings for the market have tended to be within a couple of days of a short-term peak. In other words, yesterday’s “gap up” opening was likely a good opportunity to trim positions that have gotten overweight in portfolios. For us, that was technology and discretionary sectors which we have now reduced back to target portfolio allocations.
However, on a positive note, if the bulls can indeed muster a rally above the June highs, and can hold it, it will likely be an easy stretch back to the highs of the year. With the market climbing an advancing trend (higher bottoms and higher highs), our portfolios remain weighted towards equities, although we do remain underweight from target goals. If the “bull market” reasserts itself and shows stronger breadth, then further increases in allocations may be justified.
But that point is not now. Over the last month, the bullish backdrop has become markedly less clear as the list of economic and market concerns persist. This great graphic came from Mark Raepczynski on Friday:

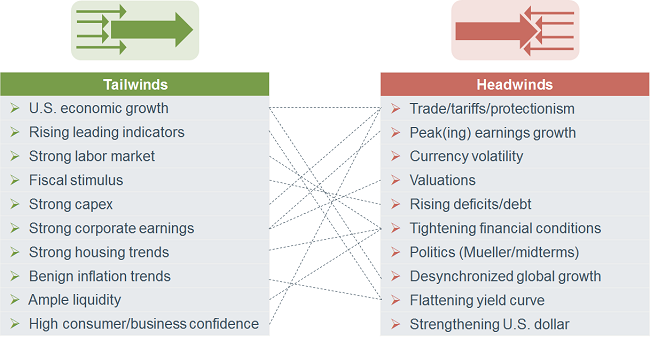
Liz Ann Sonders also took a stab at the list of headwinds facing the bulls currently:
“More broadly, at the midpoint of the year, there continue to be both headwinds and tailwinds for the economy and the market. Trade uncertainty clearly falls in the former. As you can see in the graphic below, I have loosely connected many of these, along the lines of an ‘on the one hand…on the other hand…’ analysis.”
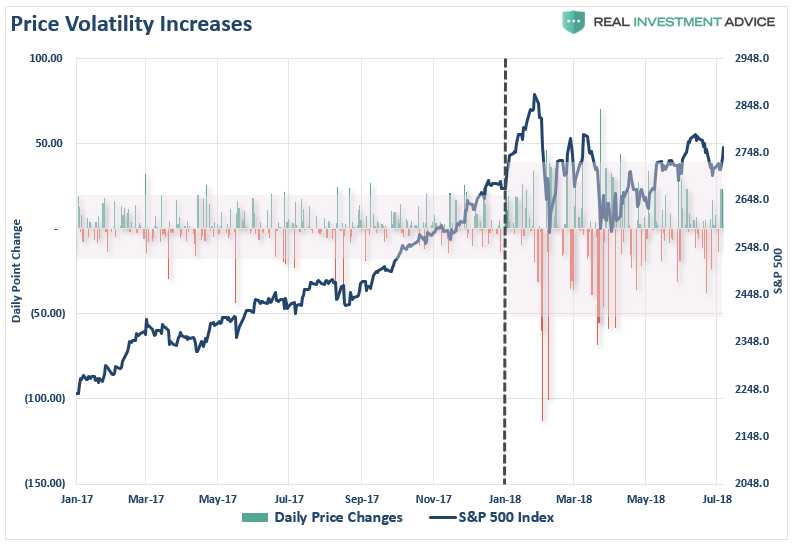
With concerns rising, it is not surprising to see that investor “optimism” has dwindled in recent weeks particularly as price volatility has risen sharply this year. The chart below shows the daily price movements of the S&P 500 from 2017 to present.
The chart below is a composite “investor sentiment” index or rather how investors “feel” about the current investing environment.

Clearly, the “exuberance” of the market has given way to more “concern” since the beginning of the year, but given sentiment remains elevated there is little to suggest real “fear” is present.
In other words, as I discussed this past weekend, despite the rise in “fear,” investors are not willing to “do” anything about. Or rather, F.O.M.O. (fear of missing out) still trumps F.O.L.M. (fear of losing money.)
“With valuations elevated and earnings expectations extremely lofty, the risk of disappointment in corporate outlooks is elevated. Furthermore, despite those who refuse to actually analyze investor complacency measures, both individual and institutional investors remain heavily weighted towards equity risk. In other words, while investors may be “worried” about the market, they aren’t doing anything about due to the ‘fear of missing out.’”


“This is the perfect setup for an eventual ‘capitulation’ by investors when a larger correction occurs as overexposure to equities leads to ‘panic selling’ when losses eventually mount.”
Overall, the market continues to quickly discount the various risks facing the market. But almost as quickly as one is “priced in,” another emerges. With “trade wars” now live, “Brexit” running into trouble and the November elections in the U.S. quickly approaching, there are plenty of concerns which still lay ahead.
Also, we continue to be concerned about the lack of overall “breadth” of the rally, which was also noted by Jim Bianco, on Monday.
“The next chart shows the impact the so-called FAANMG stocks — Facebook Inc., Apple Inc., Amazon, Netflix Inc., Microsoft Corp., and Google parent Alphabet Inc. — have had on the S&P 500 Index since November 2017. These six stocks alone pushed the S&P 500 up 2.66 percent. The other 494 stocks were collectively down 0.40 percent. Overall, the S&P 500 was up 2.26 percent.”

We have seen this in our own data. Each week in the newsletter, I provide the relative performance of various sectors in our portfolio model to the S&P 500 index. When sectors are above trending positively, and the short-term moving average is above the long-term moving average, the sectors are on “buy” signals. When the majority of sectors are on “buy signals” and the market is rising, it suggests the overall “breadth” of the rally is strong and the market should be bought.
This is what the relative performance of the model was one year ago at the beginning of July 2017.

Here is what it looks like today.
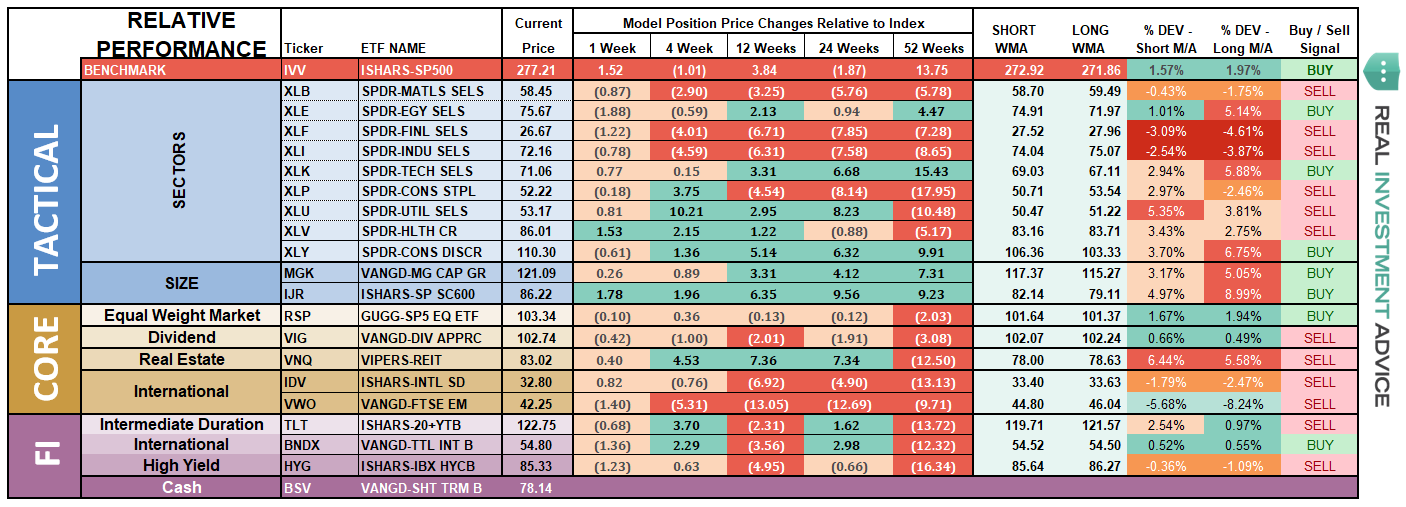
The deterioration in sector performance is indicative of a late stage market cycle, rising risks, and declines in risk/reward backdrop.
Combine the weakening performance backdrop with a market back to overbought conditions, following an abbreviated rally, and you can understand why we remain more cautionary on the intermediate-term outlook.
As Helene Meisler noted Monday:
“Friday’s breadth continued the strength we’ve been seeing. This makes it six consecutive green days for breadth.
Since prior to this string of positive breadth readings we had seen breadth alternate positive and negative every other day for two weeks, it’s not going to be easy to pinpoint the day we get overbought. However, I can note that we will be maximum overbought Friday, July 13.”
“Last week we used the Nasdaq Momentum Indicator to pinpoint Tuesday as the day we got oversold. If I use this same method to find the overbought time frame it’s far too wide to be of use. For example, it shows an overbought reading sometime between this Tuesday and next Tuesday.
Then if we use the “what if” for the McClellan Summation Index we discover that it will currently take a net differential of -1,900 (advancers minus decliners) to turn the Summation Index from up to down. In 2017 this indicator was of no help but in 2018 once this gets to the point it needs -2,000 we have been overbought. It’s hard to pinpoint the day using this method but it’s likely that if the market’s breadth is strong on Monday this will go down under -2,000.”

“Thus the conclusion is that in the latter part of this week we should reach an overbought condition.
The number of stocks making new highs on the NYSE increased. It’s nothing to write home about but at least it increased.
Finally, I would note that while anecdotally sentiment seems to have turned bullish, it is not yet evident in the indicators. The put/call ratio was 100% on Friday and while that may have been “weekend” related, long-time readers will know I prefer not to rationalize an indicator.”

We remain cautious for now until the investing risk/reward scenario improves enough to warrant additional equity exposure.
Could we miss some of the rally before that occurs? Sure.
We have no problem with that. Opportunities to take on additional market risk come along about as often as a taxi cab in New York City. However, for us, the “fear of missing out” is much less important than the “fear of losing money.” Spending our time working to recoup losses is a process we prefer to avoid.
“When it comes to investing it is important to remember that no investment strategy works all the time, but having some strategy to manage risk and minimize loss is better than no strategy at all.”


