
T2108 Update - Follow-Through On Bearish Divergence
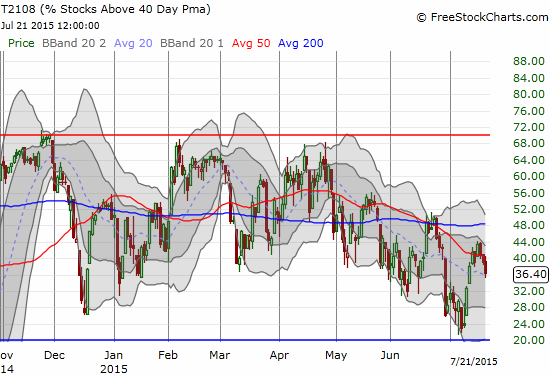
T2108 Status: 36.4%
T2107 Status: 40.2%
VIX Status: 12.2
General (Short-term) Trading Call: Neutral
Active T2108 periods: Day #187 over 20%, Day #7 over 30%, Day #2 under 40%, Day #42 under 50%, Day #59 under 60%, Day #258 under 70%
Reference Charts (click for view of last 6 months from Stockcharts.com):
S&P 500 or SPY
SDS (ProShares UltraShort S&P500)
U.S. Dollar Index (volatility index)
EEM (iShares MSCI Emerging Markets)
VIX (volatility index)
VXX (iPath S&P 500 VIX Short-Term Futures ETN)
EWG (iShares MSCI Germany Index Fund)
CAT (Caterpillar).
Commentary
During the thick of earnings season, I prefer to avoid reading deeply into the technical signals. One day’s celebration can quickly turn into the next day’s lamentations. However, the first two days of this week have delivered signals strong enough to warrant caution.
On Monday, July 20th, a bearish divergence occurred with T2108 falling for a second day in a row even as the S&P 500 (SPY) increased ever so slightly for the second day in a row. Today, July 21, the S&P 500 finally took a dip with a small 0.4% loss. In the context of the chop that preceded the last cycle of fear, today’s move looks “deep” enough to signal the end of the rally from “close enough” oversold conditions.
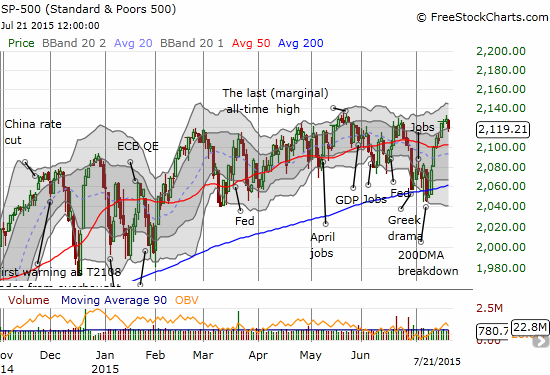
The S&P 500 turns away from resistance at the top of the current trading channel
T2108 maintains a definite downtrend from April’s high. See the drooping 50DMA.
T2108 has confirmed a bearish divergence and in a sense has dragged the S&P 500 with it. Guggenheim S&P 500 Equal Weight ETF (RSP) is one way to confirm the lag that T2108 tells us. RSP is an equal weighting of the components of the S&P 500. This weighting scheme treats all percentage moves equally regardless of market cap. RSP removes the bias that can come from a few big stocks distorting the performance of the index. In the current case, there are a few large stocks that are doing extremely well and giving the S&P 500 a boost. RSP tells a slightly different story than the S&P 500: a downtrend from recent highs is still in place. Moreover, stocks overall have barely budged year-to-date (a mere 0.7% versus the S&P 500’s admittedly modest 2.9%).
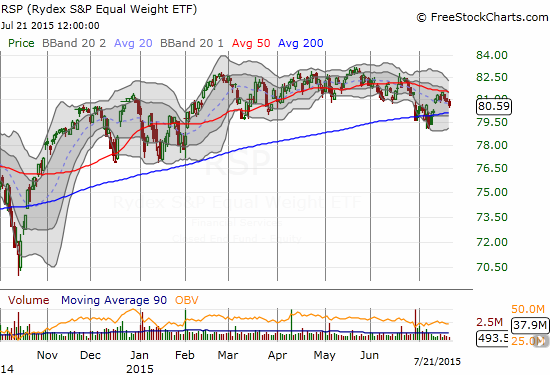
On a percentage performance basis, S&P 500 stocks have NOT shared equally in the last rally. Guggenheim S&P 500 Equal Weight ETF (RSP) is still in a downtrend from recent highs.
(A hat tip to “TraderMike” for alerting me to the relatively poor performance of RSP).
The volatility index is not yet showing any concern from the market. Indeed, with the last cycle of fear over, I cannot imagine what might hide around the corner to ignite greater fear in the market.
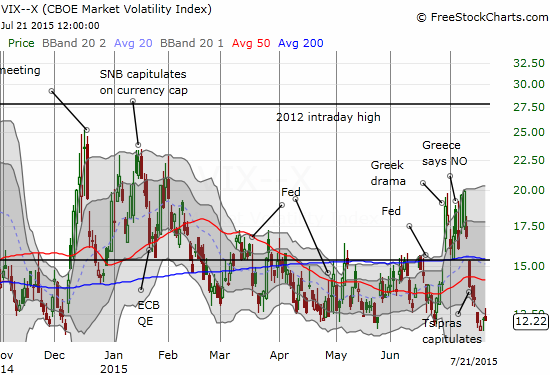
The volatility index (VIX) is not yet stirred by the confirmed bearish divergence
However, if these bearish tidings mean anything, then it sure makes sense to start buying put options while the going is cheap. The amount of short-term downside is likely limited given T2108 is already down to 36%. As a reminder, recent history has shown that starting at 30%, T2108, and thus the S&P 500, is more prone to bounce as if coming out of oversold conditions.
The Australian dollar (FXA) versus the Japanese yen (FXY) is not showing new signs of stress yet. Once (if?) AUD/JPY begins a fresh descent, I will greatly increase my bearishness (current trade bias is set at neutral).
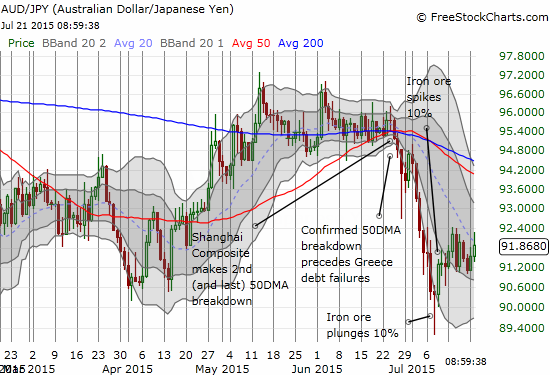
The Australian dollar is still holding steady against the Japanese yen
Caterpillar (CAT), my favorite market hedge, is scraping at recent lows and tells me to be even more cautious. The lows for 2015, and multi-year lows, seem destined for a retest soon.
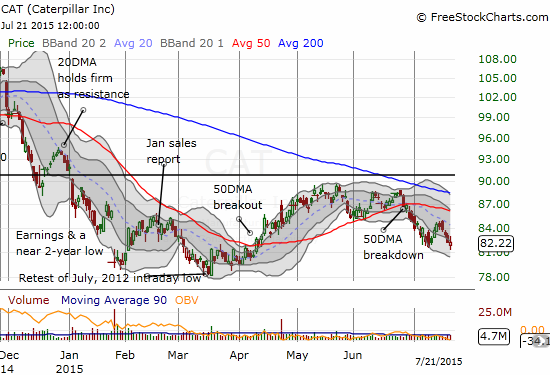
Caterpillar (CAT) is lagging and has 2015 lows in sight again
Even Apple (AAPL) may deliver a new source of caution. The tech sector has performed well recently (the big caps in particular), but AAPL’s post-earnings drop (about 6%) confirms another failed test at resistance that looks very bearish. Note that until proven otherwise, I will continue to assume that AAPL’s 50DMA is a pivot. Needless to say, the bounce from oversold conditions for AAPL has come to a very conclusive end. (Regular readers knew to sell into the rally and not hold short-term positions through earnings. I hope to post soon an update to the Apple earnings trade to help guage prospects going forward).
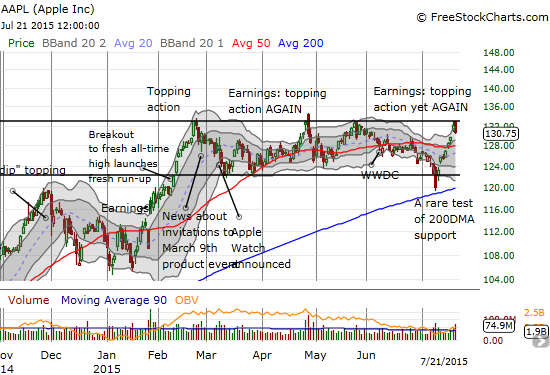
Apple (AAPL) runs into earnings-related resistance yet again
Speaking of the end of oversold trades, today I sold my last position from oversold conditions: CyberArk (CYBR). CYBR is one of my favorite cybersecurity plays. I was fortunate to load up near the recent lows. Since then, CYBE has really only experienced a net advance one additional day. Beyond that, CYBR has experienced a very slow and steady drip downward. With the buzz from the oversold bounce wearing off and CYBR lingering below 50DMA resistance, it made sense to close out this trade with the profit I have remaining. I will continue to monitor this one.
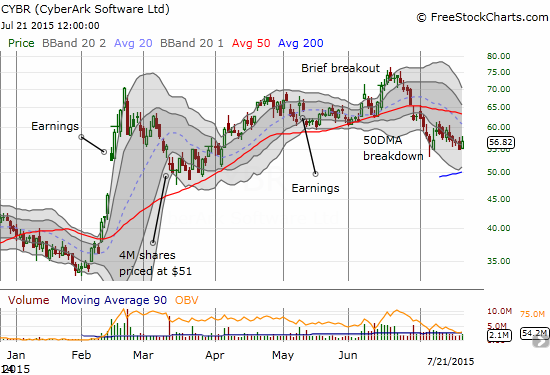
CyberArk (CYBR) has traded heavily ever since the bounce from recent lows
Finally, I have not covered gold (GLD) in a VERY long time. The commodity crash is in full effect with gold-related stocks. I hope to write a more complete post on my thoughts on gold. Suffice to say that I am licking my chops here to add to inflation hedges. Goldcorp Corporation (GG) remains my favorite gold miner – at historic 2009 lows, I “must” start loading up the truck with more gold plays. Stay tuned for more.
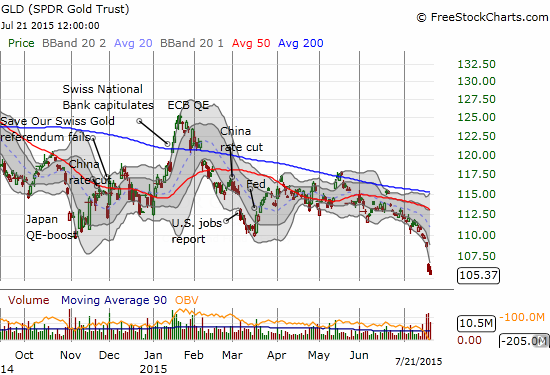
SPDR Gold Shares (GLD) continues its latest breakdown
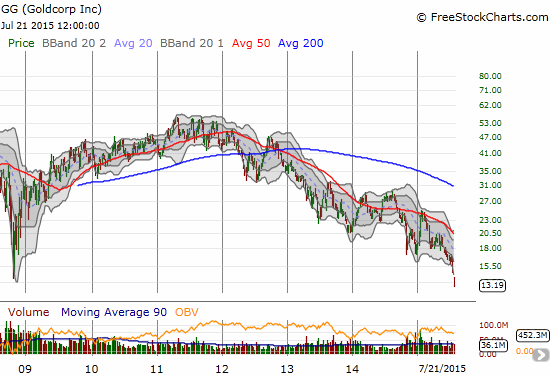
Goldcorp (GG) is back to its historic 2009 lows
Daily T2108 vs the S&P 500

Black line: T2108 (measured on the right); Green line: S&P 500 (for comparative purposes)
Red line: T2108 Overbought (70%); Blue line: T2108 Oversold (20%)
Weekly T2108

Full disclosure: short AUD/JPY, long CAT put options, long GLD, long ...
more

