
T2108 Update – Round Numbers And A Bearish Divergence
T2108 Status: 63.0%
T2107 Status: 49.7%
VIX Status: 15.8
General (Short-term) Trading Call: Neutral – waiting to see what happens when/if T2108 becomes overbought. Bearish on a close below 2087.
Active T2108 periods: Day #82 over 20%, Day #41 above 30%, Day #21 over 40%, Day #10 over 60% (overperiod), Day #152 under 70%
Reference Charts (click for view of last 6 months from Stockcharts.com):
S&P 500 or SPY
SDS (ProShares UltraShort S&P500)
U.S. Dollar Index (volatility index)
EEM (iShares MSCI Emerging Markets)
VIX (volatility index)
VXX (iPath S&P 500 VIX Short-Term Futures ETN)
EWG (iShares MSCI Germany Index Fund)
CAT (Caterpillar).
Commentary
The S&P 500’s recent chopping range did not facilitate any T2108-related trades. This second straight day closing at an all-time high still leaves the market tantalizingly close to triggering a trade. The S&P 500 finally closed at the round number of 2100. As seems the case with round numbers on indices, the market could not just pass on by without stopping right on the line.
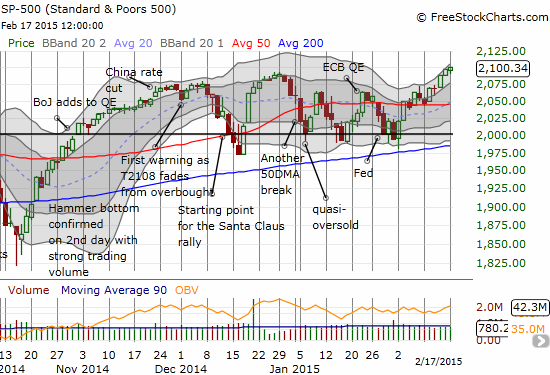
The S&P 500 finally hits the round number of 2100
This move seems like a bullish development…EXCEPT T2108 managed to lose ground. It dropped marginally from 64.5% to 63.0%. However, this bearish divergence really caught my attention this time because the volatility index, the VIX, managed to print a sizeable gain on the day. It was enough to propel the VIX over the 15.35 pivot and seemingly confirm support in the 14 to 15 area.
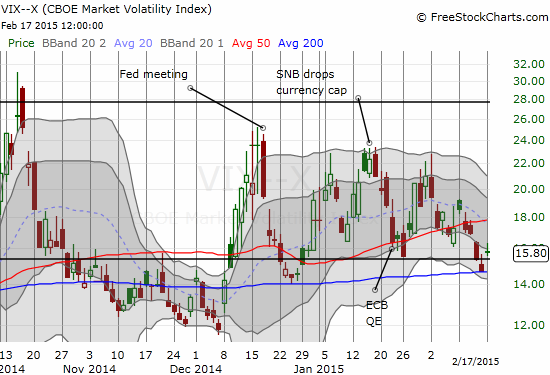
The volatility index managed to GAIN 7.6% – a surprisingly large move for an up day
I am now hesitant to extrapolate much from bearish divergences, but the VIX’s gain is at least enough to prevent me from getting bullish despite the divergence. I am even MORE wary as a result. Fortunately, there is no need to rush out to try to fade the market here. I am holding to the rule that only a close below 2087 will trigger any shorts on the S&P 500. Bullishness will continue waiting for a review AFTER T2108 becomes overbought (if overbought comes before a close below 2087 for the S&P 500).
One quick trade follow-up: Ambarella (AMBA). This trade is yet another demonstration of the value of watching the Bollinger Bands (BB). Recall from the last T2108 Update that I held onto my put options from Friday’s breakdown on AMBA in case the selling was a precursor to some bad news. No bad news came this morning, so I prepared to close out the trade at the first sign of recovery. My trade was made easier when the stock first moved lower and even further below the lower BB. I had no problem at that point locking up profits if AMBA gained at least a point off the low. Not only did that happen, but buyers furiously bought AMBA right back to the lower-BB. The 50DMA breakdown is still in play, but buyers have put everyone on notice. A close ABOVE the 50DMA will put AMBA right back into a very bullish position…especially on strong trading volume.
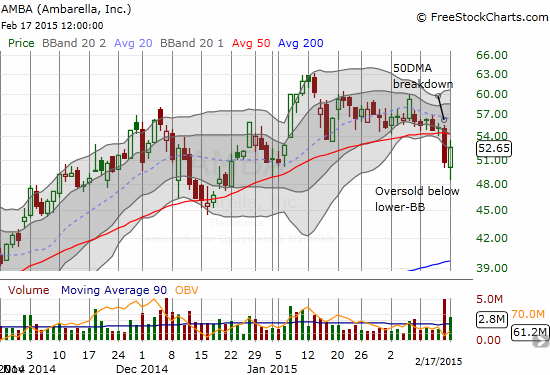
Ambarella (AMBA) stages a vigorous defense as buyers return the stock to the lower-Bollinger Band (BB) after a high-volume 50DMA breakdown
Daily T2108 vs the S&P 500

Black line: T2108 (measured on the right); Green line: S&P 500 (for comparative purposes)
Red line: T2108 Overbought (70%); Blue line: T2108 Oversold (20%)
Weekly T2108

*All charts created using freestockcharts.com unless otherwise stated
Be careful out there!
Full disclosure: no positions


