T2108 Update – A Rattling Lid Remains On The Pressure Cooker
T2108 Status: 27.3% (low of 23.8% which broke last week’s close and levels last seen in October, 2014)
T2107 Status: 39.8% (new 6+ month low)
VIX Status: 17.0 (faded from an open of 18.6)
General (Short-term) Trading Call: Bullish
Active T2108 periods: Day #178 over 20%, Day #2 under 30% (underperiod), Day #5 under 40%, Day #31 under 50%, Day #48 under 60%, Day #247 under 70%
Reference Charts (click for view of last 6 months from Stockcharts.com):
S&P 500 or SPY
SDS (ProShares UltraShort S&P500)
U.S. Dollar Index (volatility index)
EEM (iShares MSCI Emerging Markets)
VIX (volatility index)
VXX (iPath S&P 500 VIX Short-Term Futures ETN)
EWG (iShares MSCI Germany Index Fund)
CAT (Caterpillar).
Commentary
In the immediate wake of the Greek decision to say “no” to the bailout referendum, the S&P 500 futures fell 1.5%. I had this reaction…
If I traded S&P 500 futures, I would be a buyer here. $SPY Hope to get a chance on Monday to double down on fading volatility too.
— Dr. Duru (@DrDuru) July 5, 2015
It touched off some interesting discussions on StockTwits and on Twitter. In the end, my "paper trade" worked with the S&P 500 (SPY) actually going into the green for a hot minute on the day. It ended down after beating out another test of its 200DMA support.
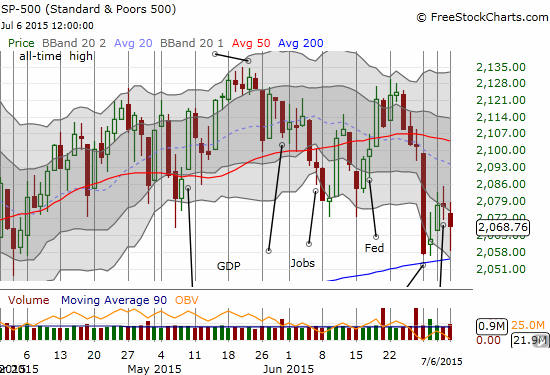
A close-up of the S&P 500 to show clearly the crowded trading around 200DMA support
I decided NOT to play the S&P 500 on the day in favor of waiting for a true oversold condition. T2108 got close, bit no cigar. It closed at 27.3% after trading as low as 23.7%. I DID go after volatility and doubled down on my put options for ProShares Ultra VIX Short-Term Futures ETF (UVXY). If this trade fails at THESE levels, I will definitely get my chance to load up on call options on ProShares Ultra S&P500 (SSO) on true oversold conditions. Volatility ended up behaving just as I would have hoped. A rattling lid remains on top of the pressure cooker as the VIX at the open and at its highs did not even come close to challenging last week’s high and faded for most of the day. The VIX still hovers above the 15.35 pivot. Note that the exact vote DID matter contrary to my technical discussion from the last T2108 Update. I am also wondering whether the VIX will stay elevated until earnings seasons gets into full swing.
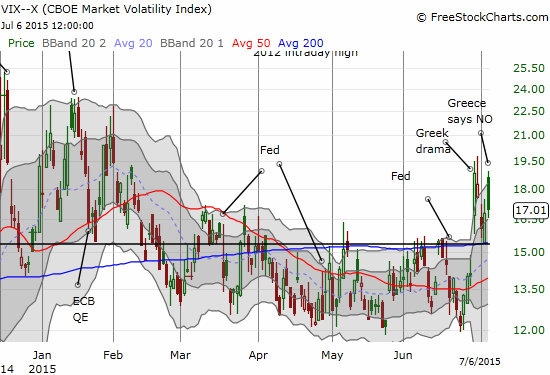
The volatility index fades for the majority of the trading day
This was a day for pictures. So I will tell the rest of the story on the day with a few key charts.
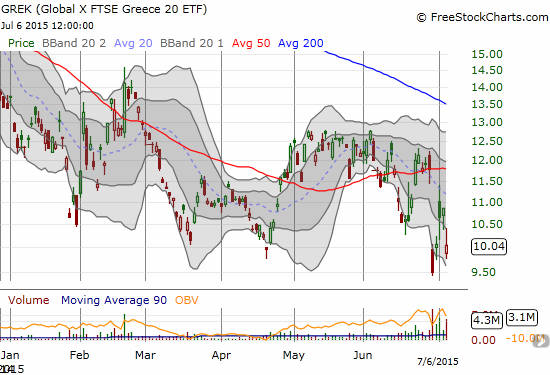
For all the hand wringing in the wake of Greece’s NO vote, Global X FTSE Greece 20 ETF (GREK) did not even break last week’s low
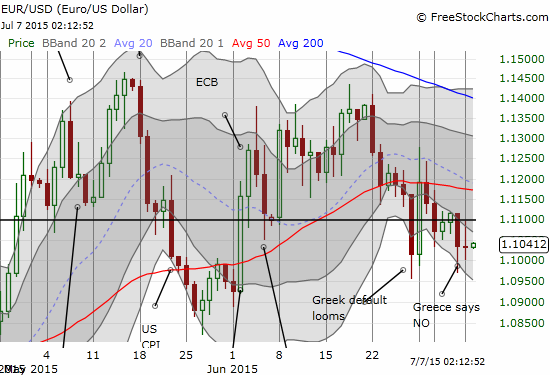
Ditto for the euro – last week’s low formed perfect support as this close-up of EUR/USD demonstrates.
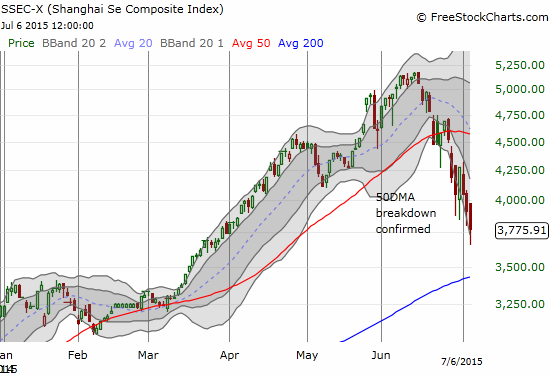
While Greece held support, China could not as announced government interventions failed to stem the selling. Traders are clearly quite happy to sell to the government.
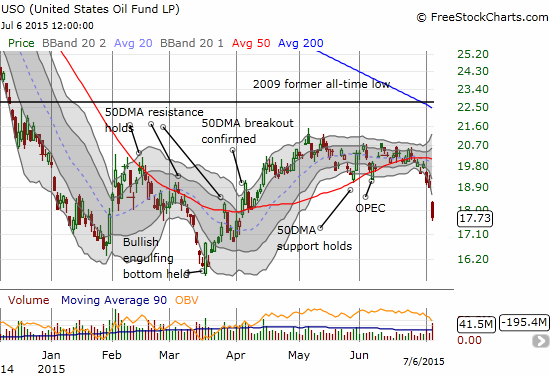
I honestly have no idea why oil fell 7.7% on the day. I have only seen attempts to back into an explanation. If there is REAL fear anywhere to be found, it is in the oil patch! The United States Oil Fund LP (USO) gapped down hard and closed down 6.3%.
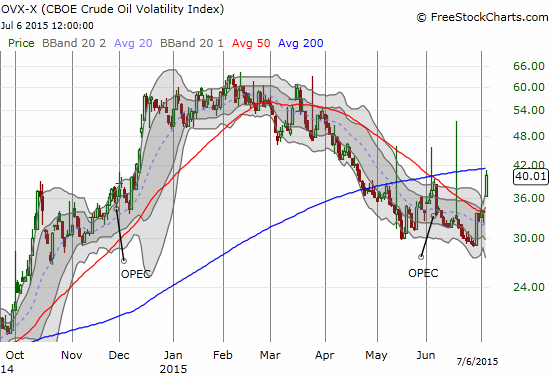
Oil volatility, as represented by the CBOE Crude Oil Volatility Index (OVX), closed above the pre-OPEC level and thus confirmed a bearish spike in fear on oil. I made one last buy of USO call options. From here, my strategy discussed in an earlier post is to maintain a bearish bias against oil. I will strongly prefer fading rallies.
Daily T2108 vs the S&P 500

Black line: T2108 (measured on the right); Green line: S&P 500 (for comparative purposes)
Red line: T2108 Overbought (70%); Blue line: T2108 Oversold (20%)
Weekly T2108

*All charts created using freestockcharts.com unless otherwise stated
Be careful out there!
Full disclosure: net short the euro, long UVXY put options, long USO call options


oil fell because the Iranian deal is not settled..Saudis are not gonna go down without a fight. They keep pumping -the tankers sitting in the Indian Ocean are choking oil. 700,000 barrels.Puny demand out there. it's headed to 45 bucks they say.Refiners are the only light in this tunnel of doom. cheers!