T2108 Upate – A Deceptively Calm Market Day
T2108 Status: 55.7%
T2107 Status: 31.9%
VIX Status: 15.3
General (Short-term) Trading Call: slightly bearish
Active T2108 periods: Day #27 over 20%, Day #26 over 30%, Day #26 over 40%, Day #24 over 50% (overperiod), Day #1 under 60% (ending 8 days over 60%) (underperiod), Day #341 under 70%
Reference Charts (click for view of last 6 months from Stockcharts.com):
S&P 500 or SPY
SDS (ProShares UltraShort S&P500)
U.S. Dollar Index (volatility index)
EEM (iShares MSCI Emerging Markets)
VIX (volatility index)
VXX (iPath S&P 500 VIX Short-Term Futures ETN)
EWG (iShares MSCI Germany Index Fund)
CAT (Caterpillar).
IBB (iShares Nasdaq Biotechnology).
Commentary
In the last T2108 Update, I continued to make the case that the market’s momentum is waning. I left out an important piece of the story: T2107 – the percentage of stocks trading above their respective 200-day moving averages (DMAs).
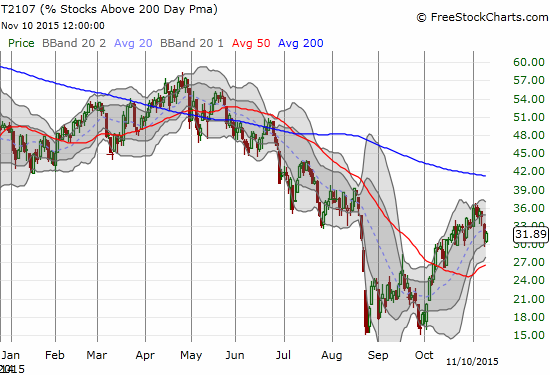
The recovery for T2107 stopped cold just short of a complete reversal of the losses from the August Angst
As the chart above shows, the percentage of stocks trading above their respective 200DMAs has yet to recover all the losses recorded since the August Angst began. This means the downtrend that accelerated starting in May is still in place and still telling us that the underlying breadth of the market’s advance is very poor. As a reminder, T2107 has been in decline ever since its first rapid post-crisis recovery.
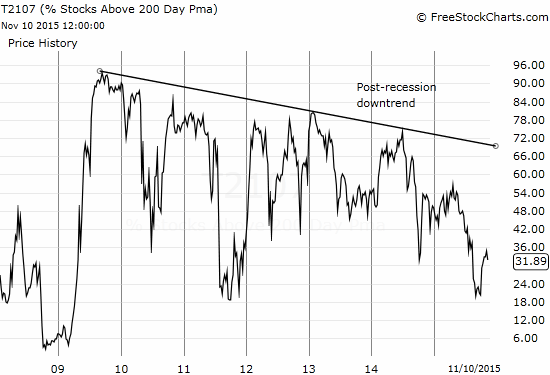
To-date, the on-going deterioration in breadth – relative to the critical long-term trend indicator 200DMA – of the market has mattered little
T2108 closed at 55.7% after recovering from early losses. For a brief moment it looked like the bearish breakdown was underway. The S&P 500 similarly held up and marked a second day honoring its 200DMA support. Note how that support has now converged with an uptrending 20DMA.
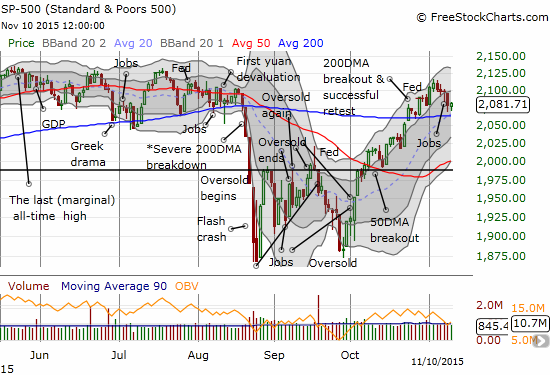
The S&P 500 (SPY) prints a small rebound above 200DMA support
The volatility index, the VIX, failed to follow through on its recent breakout. It closed right on top of the 15.35 pivot line. I am still looking for a definitive break upward or downward.
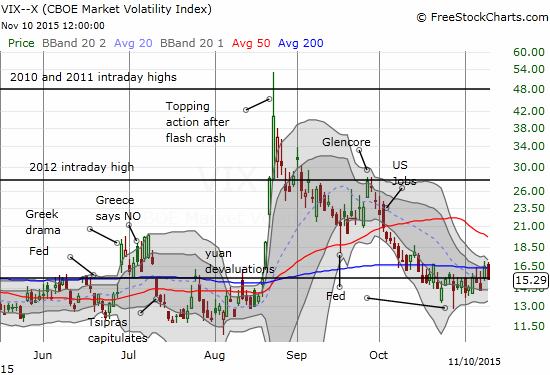
The volatility index is like a moth to a flame when it comes to the longstanding pivot at 15.35.
Speaking of churning in place, I am similarly waiting on Intuitive Surgical (ISRG) to make its next move. It has settled down quickly since printing a post-earnings fade.
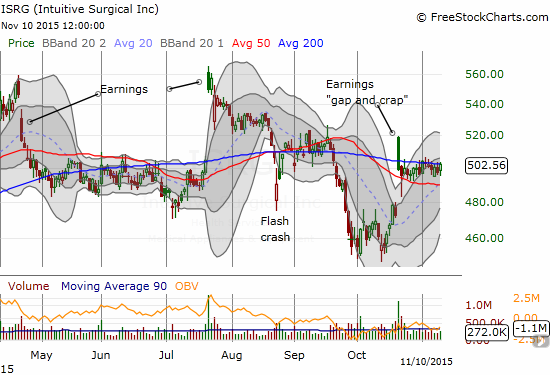
Intuitive Surgical is now stuck in post-earnings holding patterns as buyers and sellers lock horns.
Just beyond the apparent surface calm of the market, traders can still find evidence of increasing deterioration. Two important charts demonstrate more of the waning momentum I am monitoring.
Tableau Software, Inc. (DATA) had a very impressive post-earnings gap up last Friday that caught me completely off-guard. After the stock failed to show any signs of life after August earnings, I figured sentiment was starting to turn against DATA. However, it looks like the celebration is already coming to a slow end as DATA has failed to resume its post-earnings rally. Instead, its 200DMA breakout has quickly swung to a fresh 200DMA breakdown that could be the beginning of a gap fill.
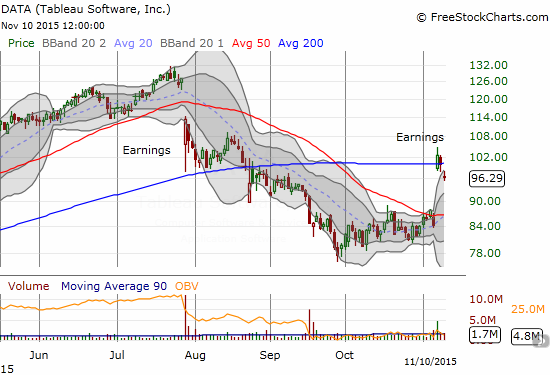
The post-earnings celebration for Tableau Software, Inc. (DATA) is already starting to wane.
Surprised one analyst note can knock $AAPL off its rocker but consistent with waning market: http://stks.co/h3QxK 200DMA holds as resist
— Duru A (@DrDuru) Nov. 10 at 03:44 PM
Credit Suisse issued a report expressing concerns about Apple’s Asian supply chain. An analyst there claims AAPL is cutting iPhone production by 10%.
I was taken aback by the market’s violent response with a 2%+ gap down that ended with a 3.2% loss on the day. Not only did this sell-off confirm the 200DMA as resistance for AAPL, but also the stock is almost right back to its price the day before earnings. Now I have to back off my post-earnings bullishness on AAPL and trade much more cautiously.
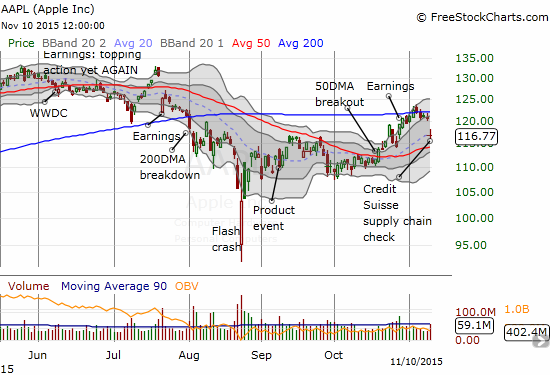
Is this readiness of sellers to dump Apple (AAPL) on a single analyst report flagging a warning that confirms waning momentum in the stock market?
All hope is not lost for AAPL, of course. The 50DMA is now trending upward. A successful retest of 50DMA support would be a very bullish event for AAPL and the tech market in general.
Finally, a big story of the day was another big sell-off in solar stocks. SunEdison, Inc. (SUNE) stunk up the joint yet again and called into question to whole notion of the YieldCo as a sustainably profitable business model for solar companies. An incredible 116.2M shares traded hands on the day – a one-day record for SUNE and almost 4x 3-month average volume. SUNE lost 22.0%. It is still well above its last major low around $1.50 set back in 2012.
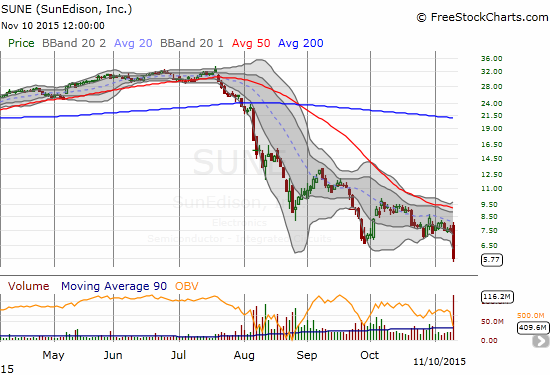
The collapse of SunEdison, Inc. (SUNE) continues with another awful earnings report.
This quote from President and CEO Ahmad R. Chatila provided by the SA transcript of the earnings call is the understatement of the day as many investors still cling to hope that SUNE can avoid the fate of so many solar companies before it that ran into doubts about the strength of its balance sheet…
“Right now, I would like the company to become a lot more boring, generating cash flows, making profits, because the market continues to grow and I do not need to grow faster than it.”
Canadian Solar (CSIQ) also reported earnings and ended the day with a much less dramatic loss. Despite the bearish engulfing pattern that indicates the end of the previous rally, at least the stock bounced well off its lows and still has the potential to find support with a new uptrending 50DMA.
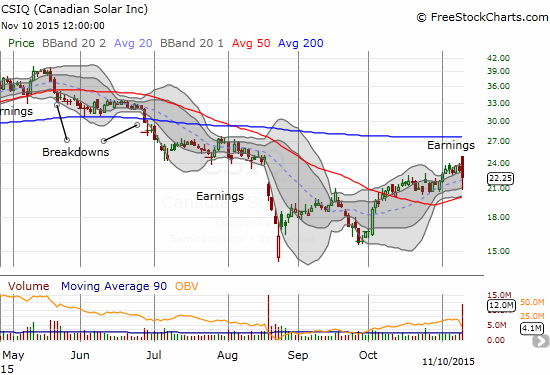
Canadian Solar (CSIQ) ends its rally with a post-earnings fade. Now 50DMA support must hold.
Needless to say, Guggenheim Solar ETF (TAN) is looking very bearish again with a fresh 50DMA breakdown.
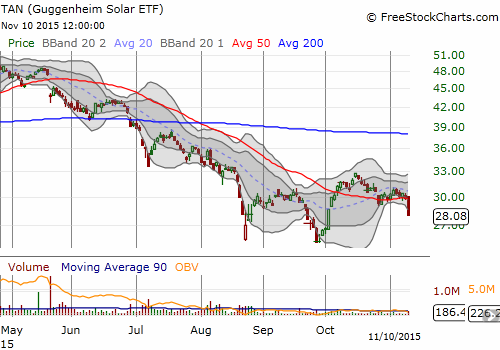
Guggenheim Solar ETF (TAN) looks ready to resume its sell-off with a fresh 50DMA breakdown
Daily T2108 vs the S&P 500

Black line: T2108 (measured on the right); Green line: S&P 500 (for comparative purposes)
Red line: T2108 Overbought (70%); Blue line: T2108 Oversold (20%)
Weekly T2108

unless otherwise stated
The charts above are the my LATEST updates independent of the date of this given T2108 post. For my latest T2108 post click here.
Be careful out there!
Full disclosure: long AAPL put spread, short shares, long call options


Hey, what can I say. This is great. Effort appreciated.
Well, thanks for reading!