
St. Louis Financial Stress and Chicago Financial Conditions Indices.
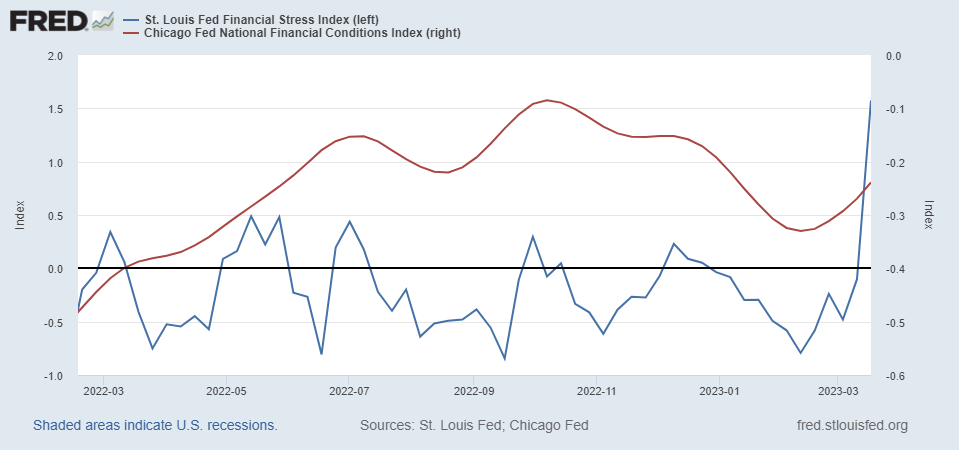
Figure 1: St. Louis Fed Financial Stress Index, v. 4.0 (blue, left scale), Chicago National Financial Conditions Index (red, right scale). “The STLFSI4 measures the degree of financial stress in the markets and is constructed from 18 weekly data series: seven interest rate series, six yield spreads and five other indicators. Each of these variables captures some aspect of financial stress. Accordingly, as the level of financial stress in the economy changes, the data series are likely to move together.” “The Chicago Fed’s National Financial Conditions Index (NFCI) provides a comprehensive weekly update on U.S. financial conditions in money markets, debt and equity markets and the traditional and “shadow” banking systems. Positive values of the NFCI indicate financial conditions that are tighter than average, while negative values indicate financial conditions that are looser than average.” Source: St. Louis Fed and Chicago Fed via FRED.
It’s hard to see exactly what this means, without comparison to recent periods of extreme financial turmoil. Below is a picture with a longer span of data.
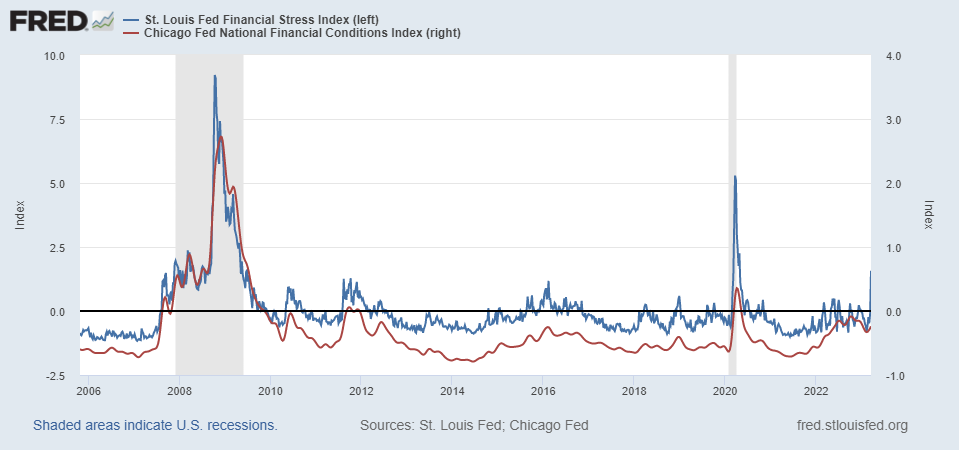
Figure 2: St. Louis Fed Financial Stress Index, v. 4.0 (blue, left scale), Chicago National Financial Conditions Index (red, right scale). Source: St. Louis Fed and Chicago Fed via FRED.
Hence, while financial stress — measured in two ways — is elevated relative to recent history, they are not close to levels recorded during the pandemic or the global financial crisis.
More By This Author:
Weekly Macro Indicators, Thru March 18Swedish Inflation: Blame It On Biden!
What Would Interest Rates Have To Be For Unrealized Losses To Be Zero


Comments
Log in or sign up to join the conversation.