
Courtesy of Ed Yardeni:
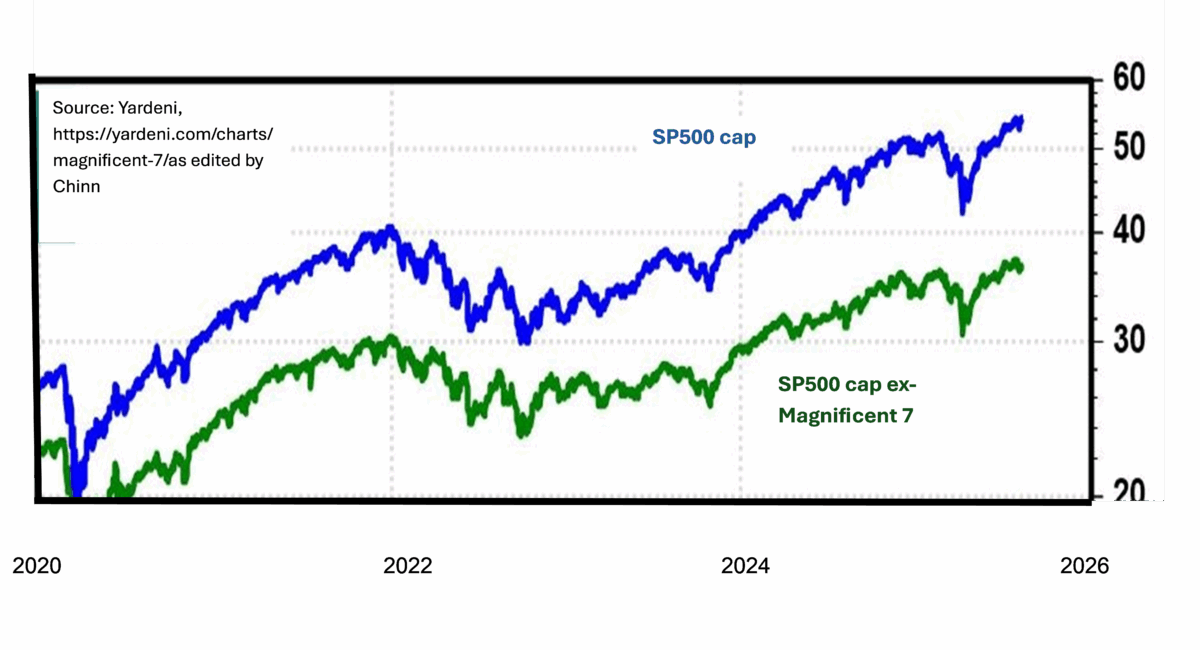
Source: Yardeni as edited by Chinn.
In terms of assessing how the general economy is responding to tariff and other uncertainty shocks, one might want to look at the SP500 excluding the Magnificent 7. As of August 8, SP500 market cap was $54.2 trillion; ex-Magnificent 7 was $36.7 trillion.
Hence, the stock market is looking quite good partly because of the performance of Apple (AAPL), Amazon (AMZN), Alphabet (GOOGL), Meta Platforms (META), Microsoft (MSFT), Nvidia (NVDA), and Tesla (TSLA) stocks. The question is whether this outperformance is durable.
One might say that the cyclically adjusted Price-Earnings (CAPE) ratio is not quite up to 2021M11 levels, so not to worry. I’ll just note that inflation expectations adjusted 10 year rates are now much higher: 2.1% in May vs. -1.0%.
(Click on image to enlarge)
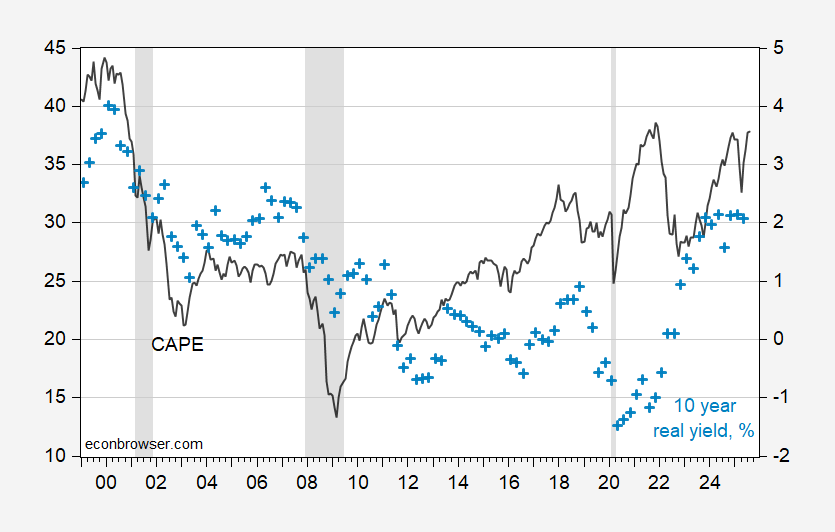
Figure 1: Cyclically adjusted price-earning (CAPE) ratio (black, left scale), and ten year ex ante real rate, % (light blue +, right scale). Real rate calculated by subtracting 10 year median SPF expected inflation rate from 10 yr Treasury yield. August CAPE observation based on data through 8/8. NBER defined peak-to-trough recession dates shaded gray. Source: Shiller, Treasury via FRED, Philadelphia Fed, NBER and author’s calculations.
More By This Author:
Equipment And Structures Investment
If You Believe The CPS Employment Series Turns Down Before The CES, Be Afraidb
Core Inflation Nowcasts And Tracking


Comments
Log in or sign up to join the conversation.