Stock Market & Economy Recap - Saturday, Nov. 6
S&P 500 Earnings Update
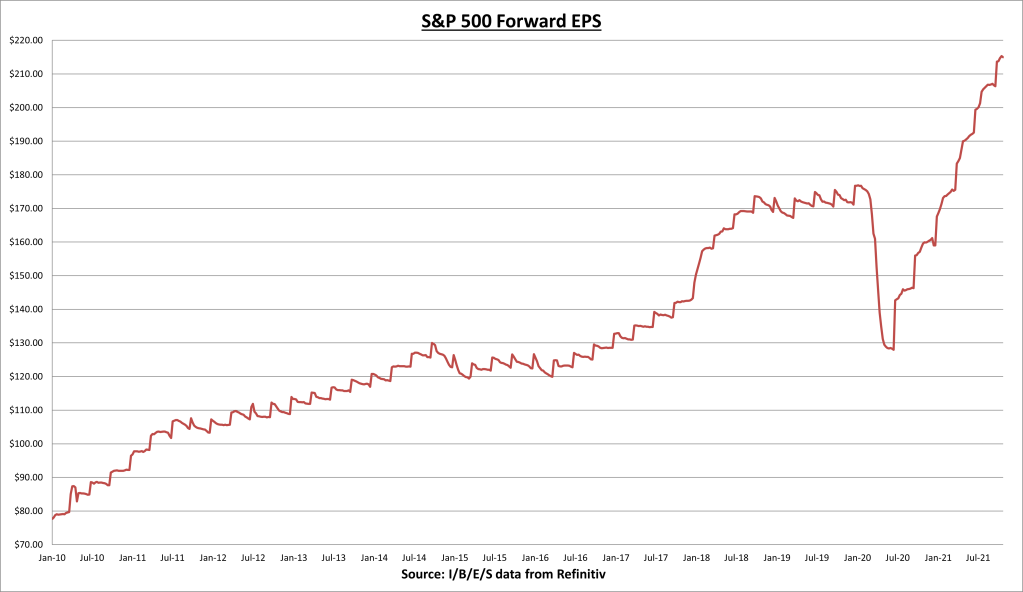
S&P 500 earnings per share (EPS) showed a modest decline this week, from $215.32 to $214.95. The forward EPS remains +35% year-to-date.
Approximately 89% of the S&P 500 have now reported Q3 results. 81% have beaten estimates and results have come in a combined 10.7% above expectations. Q3 earnings growth is now +41.5%. Another very strong quarter.
The S&P 500 price to earnings (PE) ratio moved up to 21.9 as a result of the index increasing while earnings declined.
The S&P 500 earnings yield is now 4.58%, which still compares favorably to fixed income alternatives, as the 10-year Treasury bond rate fell to 1.45%.
Economic Data Review
ISM Manufacturing Purchasing Managers Index (PMI) for October came in above expectations at 60.8.
Beneath the surface were some signs of weakness. The new orders sub-index fell from 66.7 to 59.8 for the month. A reading above 50 is considered good, so the new orders index is still growing but at a more moderate pace compared to the prior months.
Input costs (inflation) rose from 81.2 to 85.7 for the month, with all 18 industries paying higher prices for raw materials. Still no signs of relief on the inflation front. But there was some noted improvement on the employment side.
ISM Services Purchasing Managers Index (PMI) crushed expectations, coming in at an all-time high of 66.7. This is the fourth monthly record reported in this year alone.
In October, strong growth continued for the services sector, which has expanded for all but two of the last 141 months. However, ongoing challenges — including supply chain disruptions and shortages of labor and materials — are constraining capacity and impacting overall business conditions.
The new orders subindex made a new all-time high, coming in at 69.7, with all 16 industries reporting strong growth.
Unfortunately input costs also made a new all-time high at 82.9, which means there are still no signs of progress on the inflation front.
Supplier deliveries continues to underscore the effect of the shortages. In this case, any reading above 50 indicates longer wait times, which is a problem.
Overall it was another stellar report and it just makes you wonder how strong the growth could be if not for pandemic-related challenges. The Services PMI accounts for roughly 75% to 80% in today’s economy.
The BLS employment report for October showed a net increase of 531 thousand jobs, with a net gain of 604 thousand jobs in the private sector, and led by the leisure & hospitality sector (+164 thousand net jobs gained). August and September job gains were revised up by an additional 235 thousand net jobs combined.
Average hourly earnings increased 11 cents to $30.96, hourly wages are now up 4.9% over the last 12 months.
We’ve now recovered 81.2% of the net jobs lost during the COVID-19 recession, but still remain a net 4.2 million jobs below the prior peak.
Summary
This was the first week that all 4 major averages (S&P 500, Dow, Nasdaq, Russell 2000) made a new record high since February. Strong economic data and earnings continue to drive asset prices higher.
The profit margin on the S&P 500 for Q3 is around 13%, compared to profit margins of 11% in Q3 of 2020. Companies continue to become more efficient, but this isn’t just a financial engineering story. The chart above shows sales growth for the S&P 500 in Q3 is coming in at 17.3% (after growing +25.3% in Q2), this is the strongest level of sales growth in at least 15 years.
The Federal Reserve announced a policy shift this week. The emergency level stimulus (that should have been removed a long time ago) is contributing to the inflationary environment we face today. An unwinding of this policy will hopefully help alleviate some of the pressure, but we have a long way to go.
Next Week
14 S&P 500 companies will report Q3 earnings. I’ll be paying attention to Paypal (PYPL) and the Trade Desk (TTD) on Monday, as well as DR Horton (DHI) on Tuesday. For economic data we have the NFIB small business optimism index and the producer price index (PPI) on Tuesday, and the Consumer Price Index (CPI) reading for inflation on Wednesday.
I/B/E/S data is from Refinitiv.
Disclaimer: None.


