
The Operating Earnings from S&P Global (SPGI) for the S&P 500[1] continue to overstate Core Earnings[2],[3] through 2Q21. We see the same problems with GAAP Earnings, as detailed here.
Accordingly, stocks are more expensive than they appear, and the S&P 500’s valuation depends on more earnings growth than analysts expect.
Last quarter’s analysis of Core vs. Operating Earnings for the S&P 500 is here.
S&P Global’s Earnings Rebound Is Misleading
The rebound in earnings is not as robust as SPGI’s Operating Earnings suggest. At $175.50/share, SPGI’s Operating Earnings are up 40% year-over-year (YoY), while Core Earnings, at $166.29/share, are up just 25% YoY. One year ago, the S&P 500’s Core Earnings were $132.51 or 5% higher than SPGI’s Operating Earnings of $125.28, an 11% swing from being 6% lower now. SPGI’s Operating Earnings contain non-operating gains/losses that lead to exaggerating the decline and the rebound in true profits as shown in Figure 1.
Figure 1: Core Earnings vs. SPGI Operating : December 2019 to Present (through 8/18/21[4])
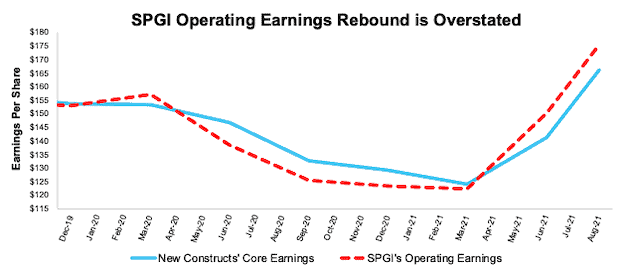
Sources: New Constructs, LLC, company filings, and S&P Global (SPGI).
Note: the most recent period’s data for SPGI’s Operating Earnings incorporates consensus estimates for companies with a non-standard fiscal year.
Our Core Earnings analysis is based on aggregated TTM data through 6/30/13, and aggregated quarterly data thereafter for the S&P 500 constituents in each measurement period. More details in Appendix I.
The Rise In the S&P 500 Outpaces the Rise in Core Earnings
Through 2Q21, Core Earnings for the S&P surpassed pre-pandemic highs and are the highest in the history of our database, which dates to December 2004. Nevertheless, Figure 2 shows rise in the price of the S&P 500 is just as strong if not stronger than the rise in Core Earnings, just as we saw in 1Q21.
Figure 2: Core Earnings vs. S&P 500 Price: 2004 to Present (through 8/18/21)
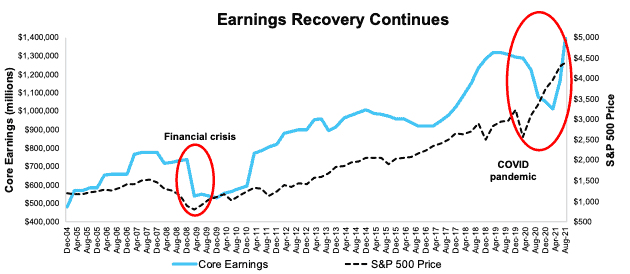
Sources: New Constructs, LLC, company filings, and S&P Global (SPGI).
Our Core Earnings analysis is based on aggregated TTM data through 6/30/13, and aggregated quarterly data thereafter for the S&P 500 constituents in each measurement period. More details in Appendix I.
S&P 500 Looks Expensive Compared to Historical Averages
Figure 3 shows the S&P 500 has rarely had a higher trailing P/E ratio based on Core Earnings or SPGI’s Operating Earnings.
Figure 3: Price-to-Core vs. Price-to-SPGI’s Operating Earnings: TTM 12/31/04 – Present (through 8/18/21)
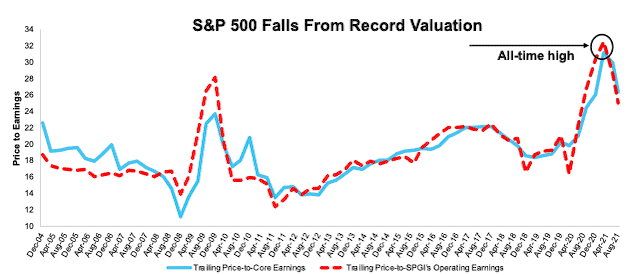
Sources: New Constructs, LLC, company filings, and S&P Global.
Note: the most recent period’s data for SPGI’s Operating Earnings incorporates consensus estimates for companies with a non-standard fiscal year.
Our Core Earnings P/E ratio is aggregating the TTM results for constituents through 6/30/13 and aggregating four quarters of results for the S&P 500 constituents in each measurement period thereafter. SPGI’s P/E is based on four quarters of aggregated S&P 500 results in each period. More details in Appendix II.
If we do not see significantly higher earnings growth than Wall Street analysts are currently forecasting, then we can expect a significant pullback in stock prices.
Core Earnings are a Less Volatile Measure of Earnings
Figure 4 highlights the differences between Core Earnings and SPGI’s Operating Earnings from 2004 to present. The differences are due to flaws in legacy fundamental datasets (detailed in this paper in The Journal of Financial Economics) that fail to capture the full impact of unusual gains/losses buried in footnotes.
Figure 4: Core vs. SPGI’s Operating Earnings Per Share for the S&P 500 – % Change: 2004 – 8/18/21
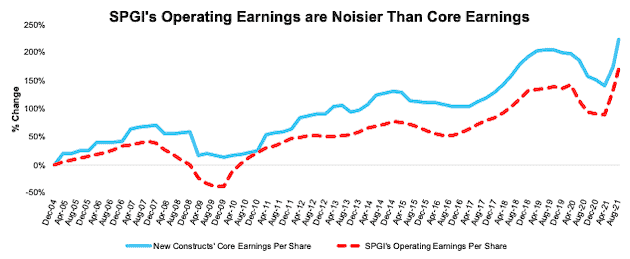
Sources: New Constructs, LLC, company filings, and S&P Global (SPGI).
Note: the most recent period’s data for SPGI’s Operating Earnings incorporates consensus estimates for companies with a non-standard fiscal year.
Our Core Earnings analysis is based on aggregated TTM data through 6/30/13, and aggregated quarterly data thereafter for the S&P 500 constituents in each measurement period.
An Example of Earnings Distortion in the S&P 500: Marathon Petroleum
Below, we detail the hidden and reported unusual items that GAAP earnings miss in the TTM 2Q21 Core Earnings for Marathon Petroleum (MPC). We are happy to reconcile our Core Earnings with Operating Earnings if S&P Global would disclose exactly how Operating Earnings differ from GAAP Earnings.
Marathon Petroleum’s Core Earnings of -$1.09/per share are less than reported GAAP Earnings of $11.80/per share. Figure 5 details the differences between Marathon Petroleum’s Core Earnings and GAAP Earnings.
Marathon Petroleum’s Earnings Distortion Score is Strong Miss. Our stock rating for MPC is Very Unattractive.
Figure 5: Marathon Petroleum’s GAAP Earnings to Core Earnings Reconciliation: 2Q21

Sources: New Constructs, LLC and company filings.
More details:
Hidden Unusual Expenses, Net = -$9 million or -$0.01/per share
- -$43 million in long-lived asset write-downs – Page 12 2Q21 10-Q
- $42 million in litigation income – Page 123 2020 10-K[5]
- -$13 million in equity method investment write-downs – Page 12 2Q21 10-Q
- $3 million gain on disposal of assets – page 6 2Q21 10-Q
Reported Unusual Expenses Pre-Tax, Net = -$2.4 billion or -$3.45/per share
- $1.4 billion in net interest and other financial costs in the TTM, based on
- -$10 million in 3Q20
- -$1.3 billion in 4Q20
- -$20 million in 1Q21
- -$579 million in impairment expense in the TTM, based on
- -$433 million in 3Q20
- -$146 million in 4Q20
- -$300 million in restructuring expenses in the TTM, based on
- -$348 million expense in 3Q20
- $1 million gain in 3Q20
- -$19 million expense in 4Q20
- $63 million gain in 4Q20
- $3 million gain in 1Q21
- -$59 million in pension and other postretirement non-service costs in the TTM, based on
- -$6 million in 3Q20
- -$56 million in 2Q21
- -$46 million contra adjustment for recurring pension costs. These recurring expenses are reported in non-recurring line items, so we add them back and exclude them from Earnings Distortion.
Reported Unusual Expenses After-Tax, Net = 9.7 billion or $14.85/per share
- $9.7 billion in gains from discontinued operations in the TTM, based on
- $371 million in 3Q20
- $833 million in 4Q20
- $234 million in 1Q21
- $8.2 billion in 2Q21
Tax Distortion = $114 million or $1.50/per share
- We remove the tax impact of unusual items on reported taxes when we calculate Core Earnings. It is important that taxes get adjusted so they are appropriate for adjusted pre-tax earnings.
How to Make Money with Core Earnings & Earnings Distortion
There are two ways investors can leverage our proprietary Core Earnings and Earnings Distortion research.
- Quants: as detailed in a paper prepared by ExtractAlpha, a long/short market neutral strategy based on Earnings Distortion alone generates a 10.1% annualized return with Sharpe ratio of 1.44.
- PMs, advisors and individuals: Figure 6 highlights the best performing stocks from our See Through the Dip reports. These Long Ideas exhibited traits the led us to believe they could weather the COVID-19 economic downturn and grow profits during the recovery. These companies continue to provide attractive/risk reward and are undervalued by the market.
Figure 6: Best Performing See Through the Dip Long Ideas
| Company | Ticker | Original Publish Date | Outperformance Vs. S&P 500 |
| HCA Healthcare | HCA | 6/22/20 | 112% |
| Simon Property Group | SPG | 4/20/20 | 87% |
| MasTec Inc. | MTZ | 6/10/20 | 85% |
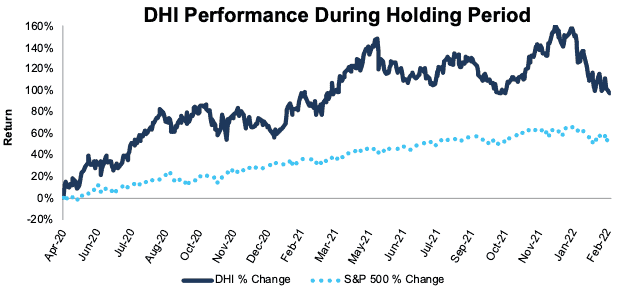
| D.R. Horton | DHI | 4/27/20 | 75% |
| General Motors | GM | 7/15/20 | 46% |
| Southwest Airlines Company | LUV | 5/4/20 | 28% |
| JPMorgan Chase & Company | JPM | 5/21/20 | 26% |
Sources: New Constructs, LLC and company filings.
*Performance measured from date report originally published through 8/25/21
This article originally published on August 26, 2021.
Appendix I: Core Earnings Methodology
In the Figures above, we use the following to calculate Core Earnings:
- aggregated annual data for constituents in the S&P 500 for each measurement period through 6/30/13
- aggregated quarterly data for constituents in the S&P 500 for each measurement period post 6/30/13 to the present
While we prefer aggregated quarterly numbers, we have examined the potential impacts of the two methodologies and have found no material differences.
Appendix II: P/E Ratio Methodology for Core & SPGI’s Operating Earnings
In Figure 3 above, we calculate the price-to-Core Earnings ratio through 6/30/13 as follows:
- Calculate a TTM earnings yield for every S&P 500 constituent
- Weight the earnings yields by each stock’s respective S&P 500 weight
- Sum the weighted earnings yields and take the inverse (1/Earnings Yield)
We calculate the price-to-Core Earnings ratio for periods post 6/30/13 as follows:
- Calculate a trailing four quarters earnings yield for every S&P 500 constituent
- Weight the earnings yield by each stock’s respective S&P 500 weight
- Sum the weighted earnings yields and take the inverse (1/Earnings Yield)
We use the earnings yield methodology because P/E ratios don’t follow a linear trend. A P/E ratio of 1 is “better” than a P/E ratio of 30, but a P/E ratio of 30 is “better” than a P/E ratio of -15. In other words, aggregating P/E ratios can result in a low multiple due the inclusion of just a few stocks with negative P/Es.
Using earnings yields solves this problem because a high earnings yield is always “better” than a low earnings yield. There is no conceptual difference when flipping from positive to negative earnings yields as there is with traditional P/E ratios.
By using quarterly data as soon as its available, we better capture the impact of changes to S&P 500 constituents on a quarterly basis. For example, a company could be a constituent in 2Q18, but not in 3Q18. This method captures the continuously changing nature of the S&P 500 constituency.
For all periods in Figure 3, we calculate the price-to-SPGI’s Operating Earnings ratio by summing the preceding 4 quarters of Operating Earnings per share and, then, dividing by the S&P 500 price at the end of each measurement period.
[1] Current period excludes Organon (OGN) due to lack of quarterly filings and V.F. Corporation (VFC) due to a filing transitional period in 2018 causing comparability issue with previous filings.
[2] Only Core Earnings enable investors to overcome the inaccuracies, omissions and biases in legacy fundamental data and research, as proven in Core Earnings: New Data & Evidence, a paper in The Journal of Financial Economics.
[3] Our Core Earnings research is based on the latest audited financial data, which is the 2Q21 10-Q for most companies. Operating Earnings from S&P Global is based on the same time frame.
[4] The earliest date that the 2Q21 10-Qs for all S&P 500 constituents were available.
[5] This item was found only in the 10-K, so to calculate TTM values, we assume the charge was spread evenly throughout the four quarters in 2020.
Comments
Log in or sign up to join the conversation.