
The morning after the Fed and stocks are continuing to punch higher, even as Treasury rates tread higher, as well. While yesterday’s message did bring up the timeline for possible rate hikes, there was also no formal announcement of taper from the FOMC and that latter item appears to be what markets are focusing on at the moment. After all, Powell has repeatedly said to take the dot plot matrix with a grain of salt, so that appears to be what we have driving prices today.
On the taper front – Powell did say that the bank could be ready for such an announcement soon, perhaps even at the next FOMC rate decision in November. Key will be employment data, so expect extra attention paid to the next NFP report in October. The November NFP report will actually release after the Fed’s rate decision (scheduled for Tuesday/Wednesday, November 2-3); so the focus on employment data will likely be intense ahead of that next rate decision.
In response to yesterday’s more hawkish dot plot matrix, US Treasury rates are continuing higher and the 10 Year note is now yielding a two-month-high, trading above 1.4% for the first time since July.
Normally, a move of this nature would have some pressure on stocks. But, so far this morning, little of that has shown, as we’ll look at below.
US Treasury 10 Year Note Yield: Fresh Two-Month-Highs

Chart prepared by James Stanley; TNX on Tradingview
Stock prices are rallying in response to yesterday’s FOMC outlay, and US equities are further recovering from the Evergrande fears that showed up in US markets earlier this month. While that situation is still developing, bulls appear to be brushing off some of that risk while pushing the S&P 500 to a fresh weekly high. This has finally closed the gap that showed up to start this week’s trade.
On the below chart, I’m looking at SPY, an ETF representing the S&P 500. Price action has held fairly well along this Fibonacci retracement encompassing the May-September major move. The Monday gap-down and continued sell-off ran all the way to the 50% retracement of that major move. But – that level held and prices started to tilt higher on Tuesday and have continued to do so since, getting a boost from yesterday’s FOMC rate decision.
S&P 500 Daily Price Chart (SPY)
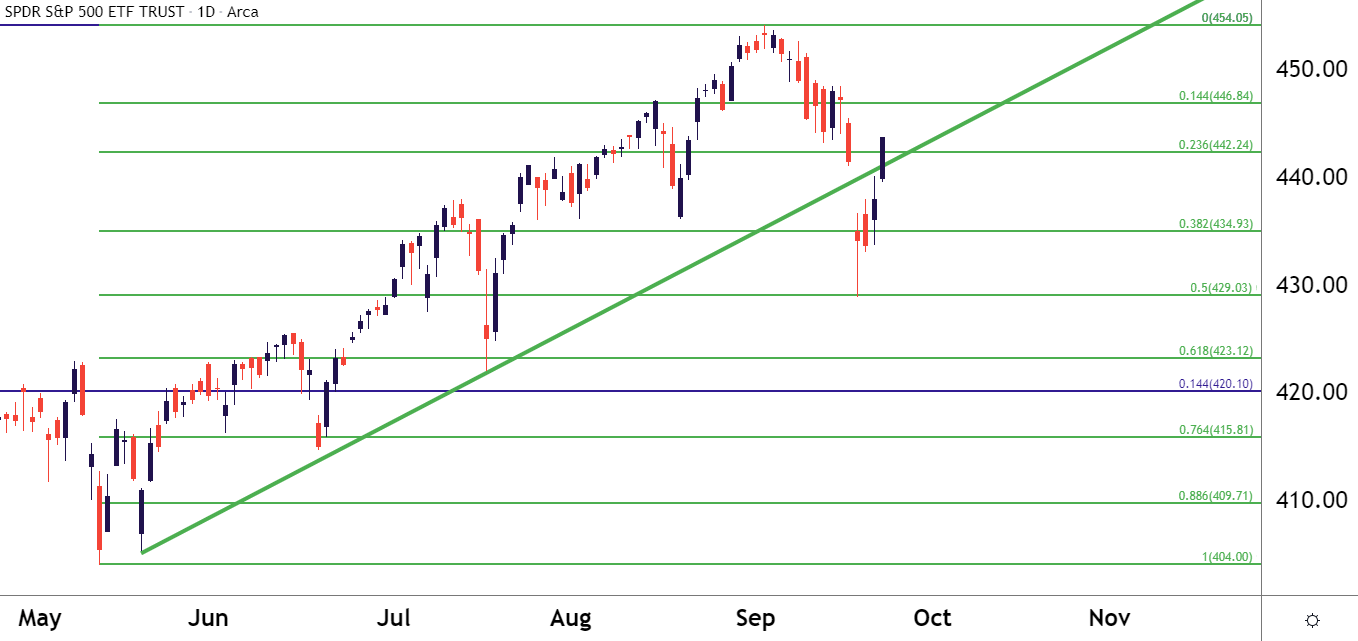
Chart prepared by James Stanley; S&P 500 on Tradingview
Nasdaq Forms Morning Star Off Of Support
I had looked into those sell-offs on Monday, highlighting a support level in the Nasdaq 100 that’s continued to help hold the lows. The three-day sequence of price action in the index has produced a morning star formation, often followed with the aim of bullish reversal potential, highlighting a possible bottom in the market.
That formation has continued with today’s strength, keeping the door open for bullish resumption scenarios. But, traders would likely want to remain cautious of dynamics in the Treasury market as the 10 year note has been selling off with yields rising, which has recently been an item of sensitivity for the tech-heavy index.
Nasdaq 100 Daily Price Chart

Chart prepared by James Stanley; Nasdaq 100 on Tradingview


Comments
Log in or sign up to join the conversation.