

Image source: Pixabay
S&P 500, Nasdaq 100, and Dow Jones Forecasts and Analysis
- Post-US CPI dump and pump muddies the equity market outlook.
- Tesla, Goldman Sachs, Netflix, and Snap all post earnings next week.
US equity markets slumped and then rallied back sharply on Thursday after the latest US inflation readings came in higher than expected. The current consensus on the move is that market participants were heavily short going into the release and that after the initial sell-off, buyers appeared to cover shorts and found covering difficult and increasingly costly.
The Nasdaq 100 fell around 500 points before rallying by in excess of 700 points, while the S&P made a low print of 3,490 before ending the session around 3,680. It remains to be seen if these gains can be kept in the coming days, especially as companies begin to release their Q3 earnings.
Next week’s earnings calendar is reasonably full, with a few standout names opening their books. Bank of America (BAC) releases before the US markets open on Monday, Goldman Sachs (GS) releases before the market open on Tuesday along with Johnson & Johnson (JNJ), and Netflix (NFLX) will be releasing figures after the close.
Tesla (TSLA) reports after the market closes on Wednesday, while SNAP (SNAP) releases after the close on Thursday. This is a mixed bag of heavyweight names - especially JNJ and TSLA - all of whom can move market sentiment and price. The US economic calendar next week is fairly light, leaving Q3 releases as the main drivers.
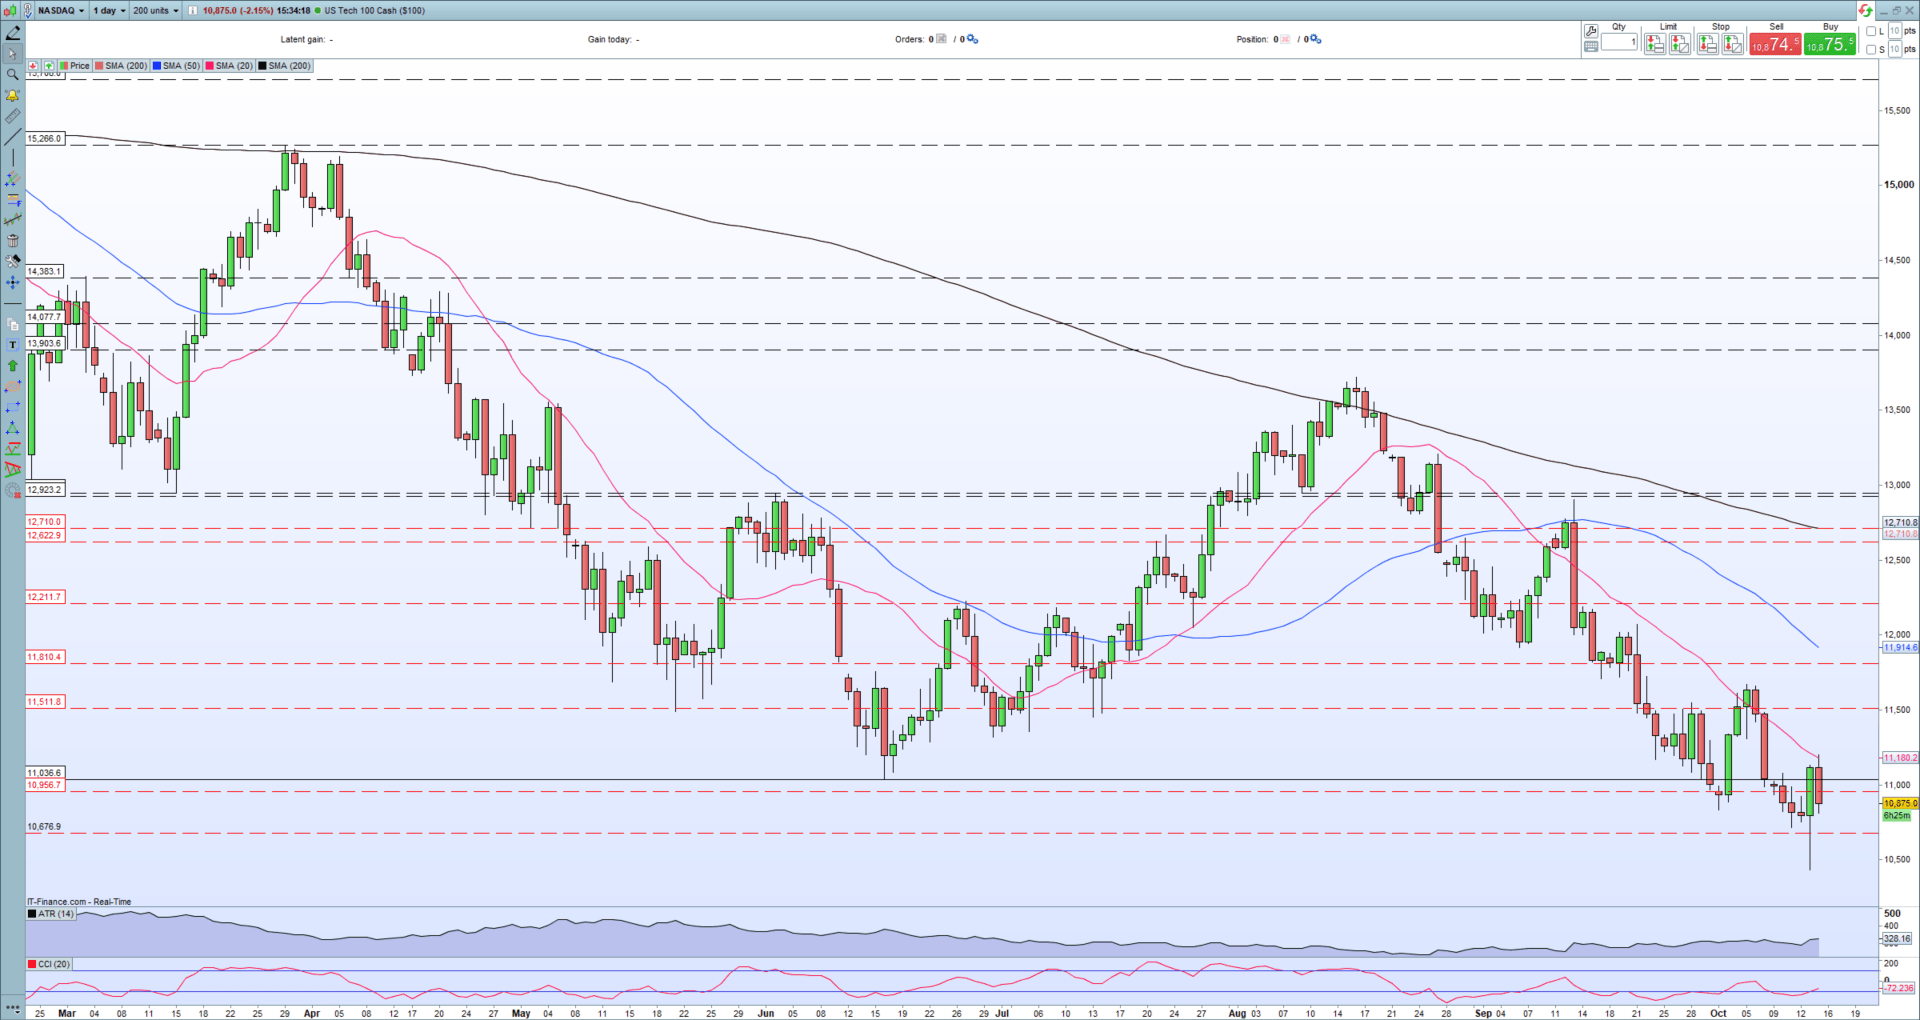
The Nasdaq 100 daily chart remains negative, despite Thursday’s rally. A series of lower highs and lower lows remain in place, while all three simple moving averages are weighing down on the index.
Nasdaq 100 – Daily Chart
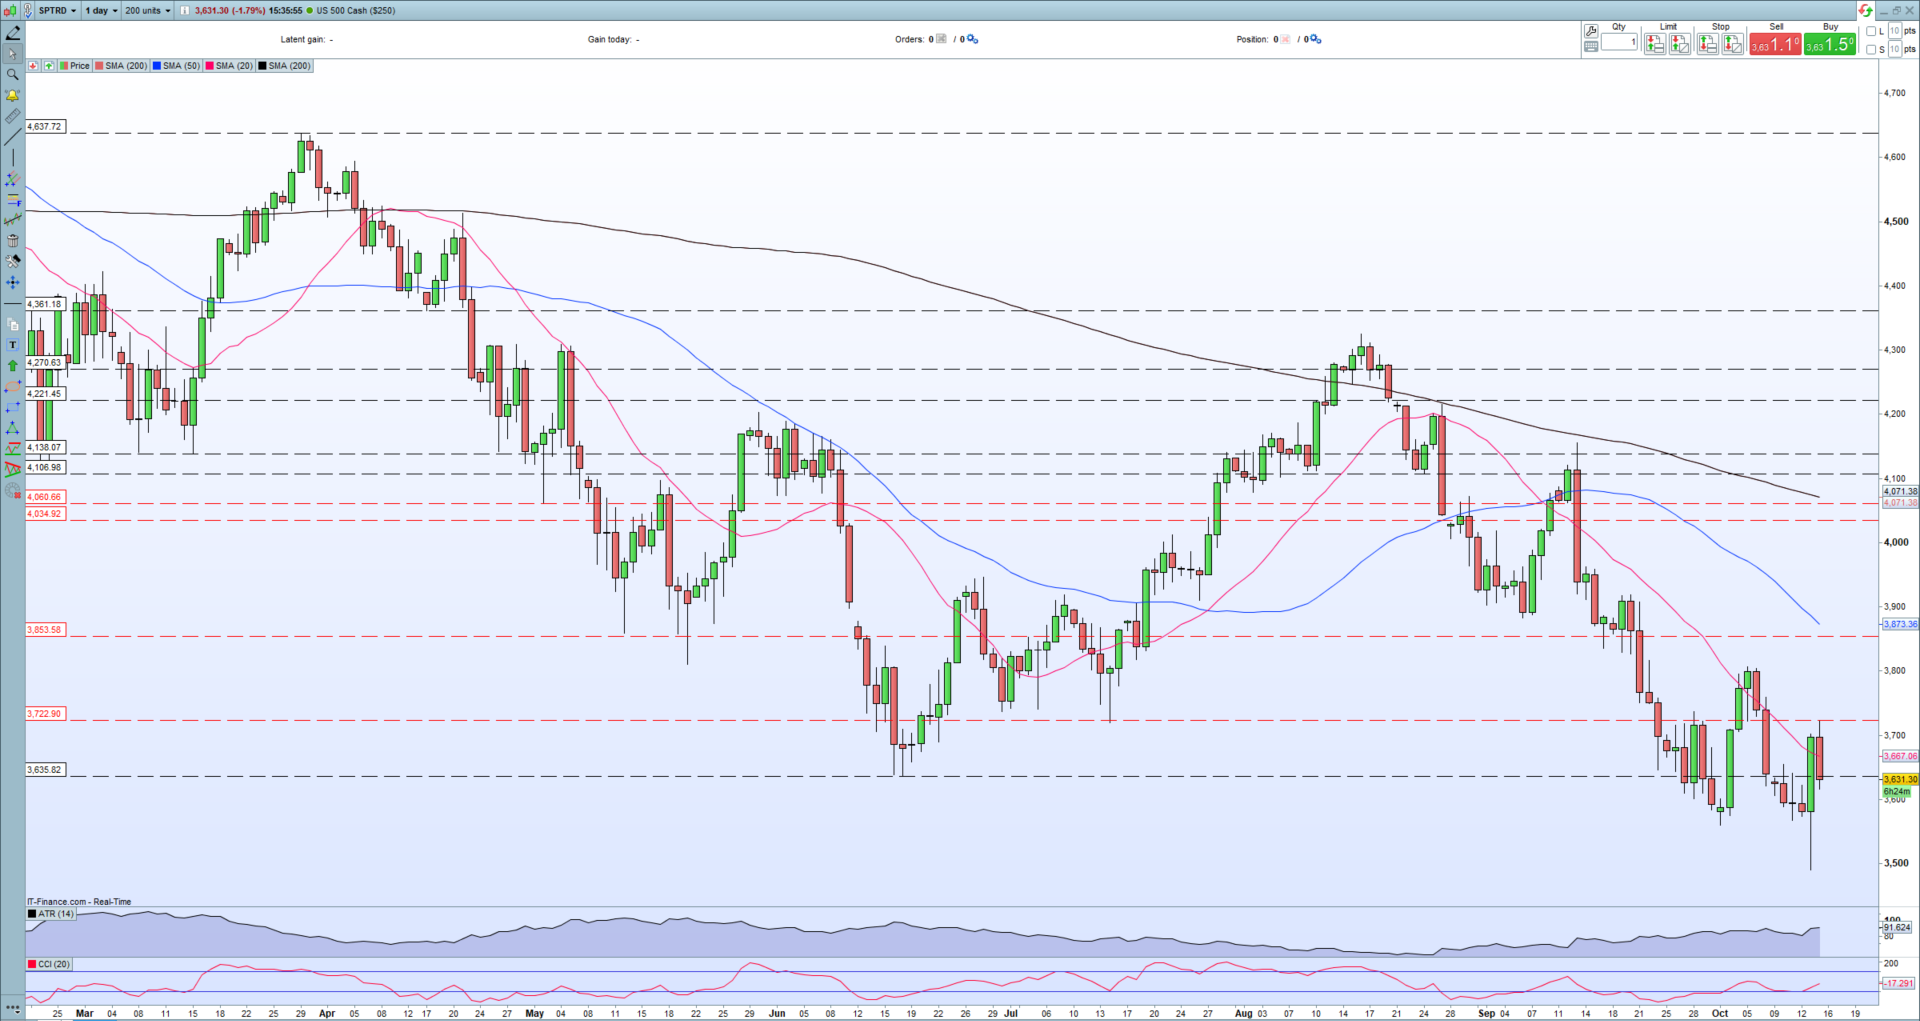
Meanwhile, the S&P 500 has a very similar setup to the Nasdaq.
S&P 500 – Daily Chart
Retail trader data shows 61.33% of traders are net-long, with the ratio of traders long to short at 1.59 to 1. The number of traders net-long is 10.90% lower than yesterday and 2.22% lower from last week, while the number of traders net-short is 7.60% higher than yesterday and 6.34% lower from last week.
We typically take a contrarian view to crowd sentiment, and the fact traders are net-long suggests S&P 500 prices may continue to fall. Positioning is less net-long than yesterday but more net-long from last week. The combination of current sentiment and recent changes gives us a further mixed S&P 500 trading bias.
US S&P 500 Sentiment: Bearish. Data provided by IG.
More By This Author:
Bitcoin (BTC) Latest – A False Break Or A Reason To Be Optimistic?
Gold Price Struggles To Hold Support As US Inflations Data Looms
British Pound (GBP) Latest: UK Economy Contracts, BoE Bond Buying Dilemma


Comments
Log in or sign up to join the conversation.