
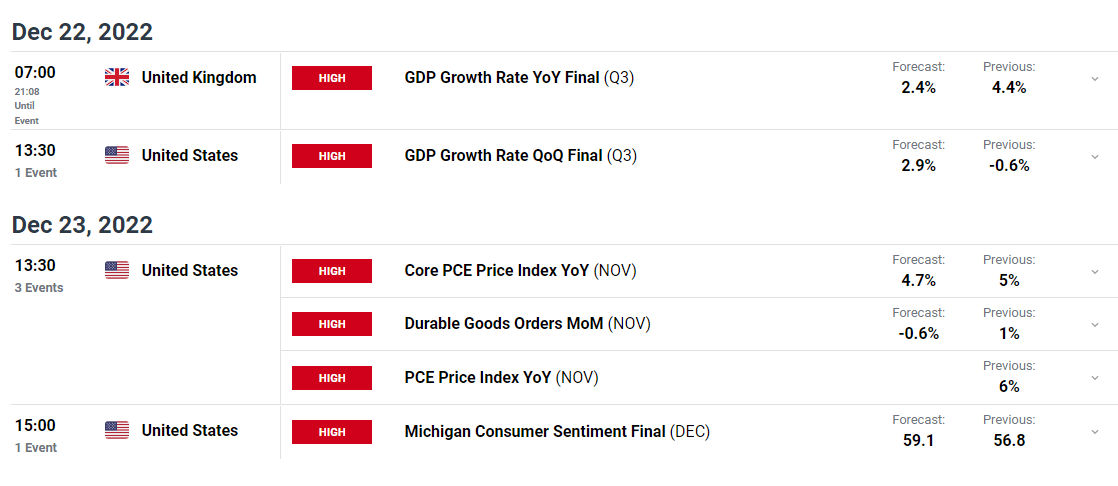
The latest FOMC minutes underscore the US central bank’s determination to stamp down on inflation, whatever the short-term collateral damage. The FOMC minutes revealed that ‘many participants emphasized that the cost of taking too little action to bring down inflation likely outweighs the cost of taking too much action’. While financial markets have already priced in 75 basis point hikes at the next two Fed meetings, if inflation turns markedly lower then the Fed may dab the brakes on monetary tightening. Fed vice chair Lael Brainard recently warned that the recent series of rate hikes may be slowing the US economy down in unobserved ways, while another Fed dove, Chicago Fed President Charles Evans noted that while rates need to remain at elevated levels, ‘overshooting is costly…this puts a premium on the strategy of getting to a place where policy can plan to rest and evaluate data and developments’. Today’s US inflation data (13:30 BST) will need to be monitored closely, but will also need to deviate substantially from expectations to change the Fed’s thinking.
US Treasury yields, a dominant driver of the gold price in recent months, are steady today ahead of the inflation report, albeit at elevated levels. The US 2-year remains around levels last seen 15 years ago, although the double-top pattern currently being made suggests that US short-term yields may be peaking.
US Treasury 2-Year Yield Daily
(Click on image to enlarge)
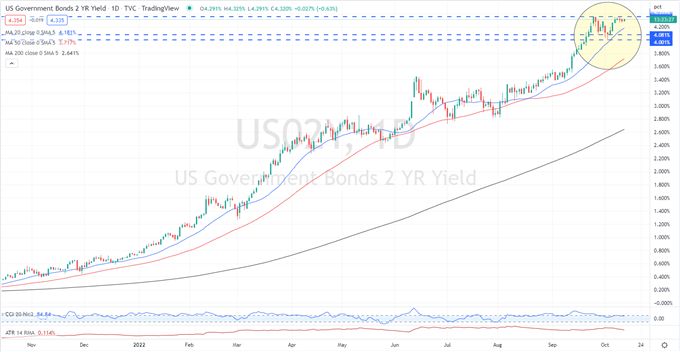
Chart via TradingView
Gold is currently sitting in a holding pattern ahead of the US inflation report. The longer-term downtrend remains dominant – lower highs and lower lows - and suggests that a re-test of the recent $1,615 low is likely. If support is around $1,660/oz. falls, then $1,640/oz. comes into play. Short-term resistance is seen around $1,682/oz.
Gold Daily Price Chart
(Click on image to enlarge)
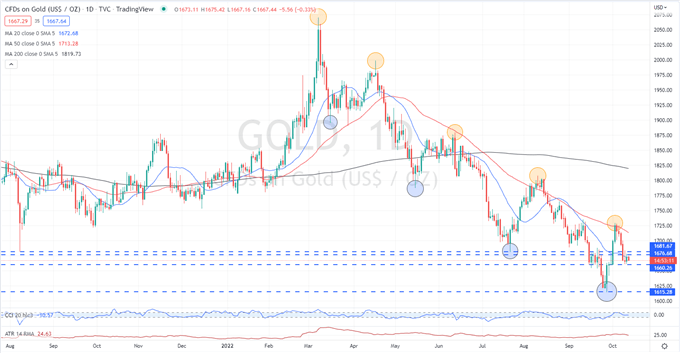
Chart via TradingView
Retail trader data show that79.45% of traders are net-long with the ratio of traders long to short at 3.87 to 1. The number of traders net-long is 3.01% higher than yesterday and 7.68% higher than last week, while the number of traders net-short is 1.83% higher than yesterday and 7.13% lower than last week.
We typically take a contrarian view to crowd sentiment, and the fact traders are net-long suggests Gold prices may continue to fall. Traders are further net-long than yesterday and last week, and the combination of current sentiment and recent changes gives us a stronger Gold-bearish contrarian trading bias.
What is your view on Gold – bullish or bearish?
More By This Author:
British Pound (GBP) Latest: UK Economy Contracts, BoE Bond Buying Dilemma
Euro Forecast: EUR/USD Sinks Further, 20-Year Low Back In Play
British Pound Latest: GBP/USD Rallies As BoE Boosts Gilt Market Liquidity


Comments
Log in or sign up to join the conversation.