S&P 500 50-Day Once Again Defended As Fed Readies To Taper/Tighten
The 50-day on the S&P 500 (SPX) was once again defended. Households’ equity exposure is on course for yet another high in 3Q, even as margin debt jumped to yet another record in August. Amidst these signs of excesses, the Fed wants to both taper and tighten, no matter how small a window it may be playing with.
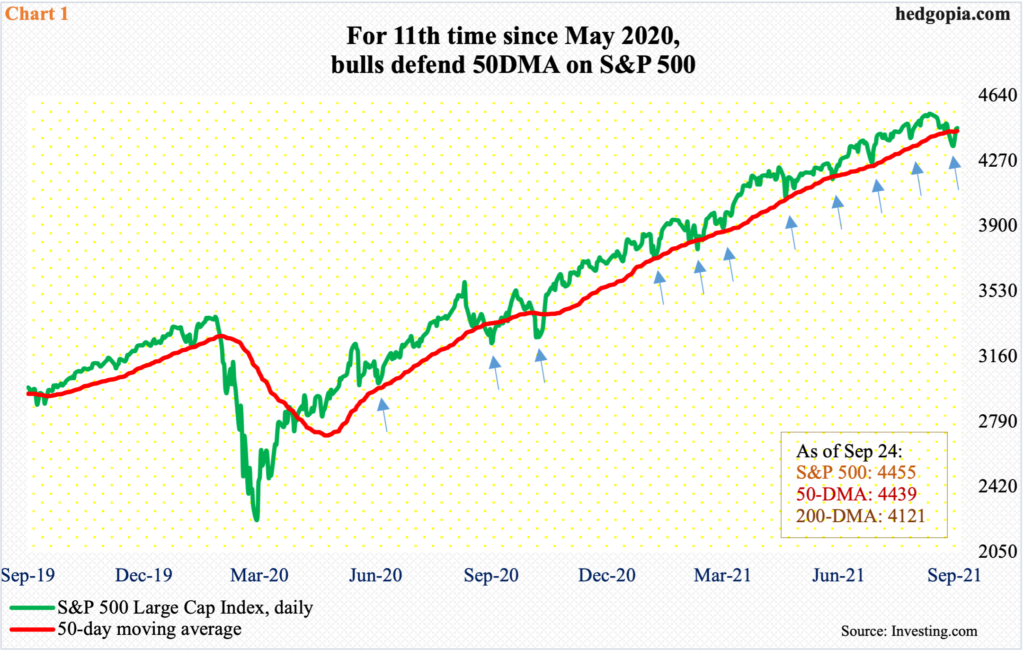
Yet again, equity bulls used the 50-day as an opportunity to buy the S&P 500 (SPY). The average was meaningfully breached last Monday but was reclaimed on Thursday. After coming under pressure in the first two sessions, the large cap index rallied in the next three. At Monday’s low, the index (4455) was down 2.9 percent but recovered enough to end the week up 0.5 percent. In the end, a bullish hammer showed up on the weekly.
This was the 11th time from May last year the 50-day attracted bids (Chart 1). This time around, from the September 2 record high of 4546 through last Monday’s low, the S&P 500 dropped 5.3 percent. It has not had a double-digit decline since last September when it dropped north of 10 percent from high to low.
Near term, there is decent resistance at 4480s, and after that of course the September 2 high.
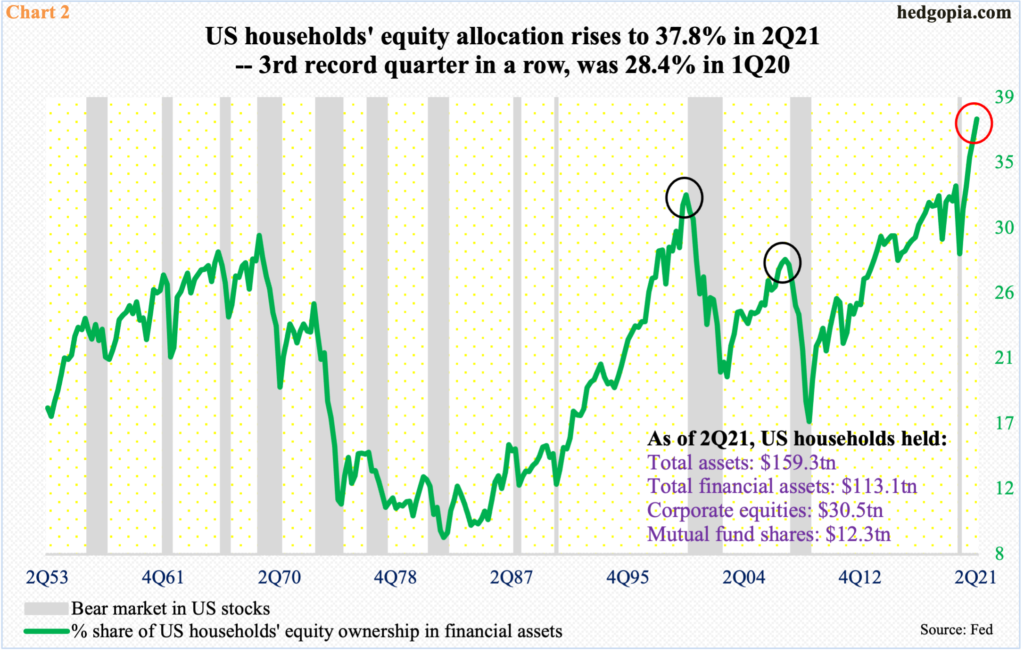
September has four sessions left. The S&P 500 is so far up 3.7 percent in 3Q. If these gains hold, this will have further raised US households’ equity allocation. It is already looking too lop-sided.
In 2Q, their equity ownership in financial assets was 37.8 percent – a new high (Chart 2). The metric has just about gone parabolic since 1Q last year when it dropped to 28.4 percent.
Interestingly, households’ equity exposure is comfortably above prior highs from 2000 and 2007, with 1Q00 at 32.5 percent and 2Q07 at 28 percent. Back then, a bear market soon followed and sustained for a while. This time is proving to be different.
Leverage is acting as a big tailwind. But margin debt cuts both ways – helps on the uptrend and hurts on the downtrend. So far in the current cycle, it has been nothing but a tailwind.
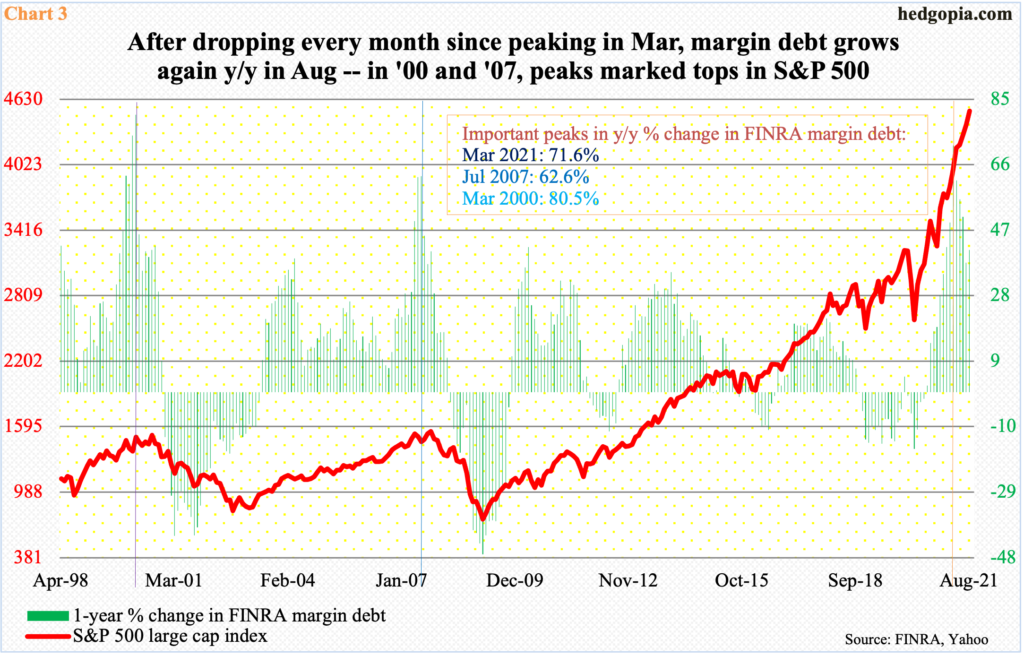
In March last year, FINRA margin debt bottomed at $479.3 billion. Then it rose every month until July this year when it declined $37.8 billion month-over-month to $844.3 billion. For a moment, it looked like it has peaked. Then again, August shot up a record $67.2 billion to $911.5 billion – a new record (chart here).
In the past, the year-over-year percent change in margin debt coincided or slightly preceded important tops in the S&P 500. Both peaked together in March 2000; in 2007, margin debt peaked in June and the S&P 500 in October.
In the current cycle, margin debt surged 71.6 percent y/y before growth decelerated in the next four months. Unlike in 2000 and 2007, the S&P 500 has continued higher. In August, the y/y growth accelerated a tad, to 41.2 percent, from July’s 37.6 percent, but the metric remains substantially under the March high (Chart 3). That said, the fact remains that the S&P 500 is yet to catch up with it.
Shorts see this and get excited.
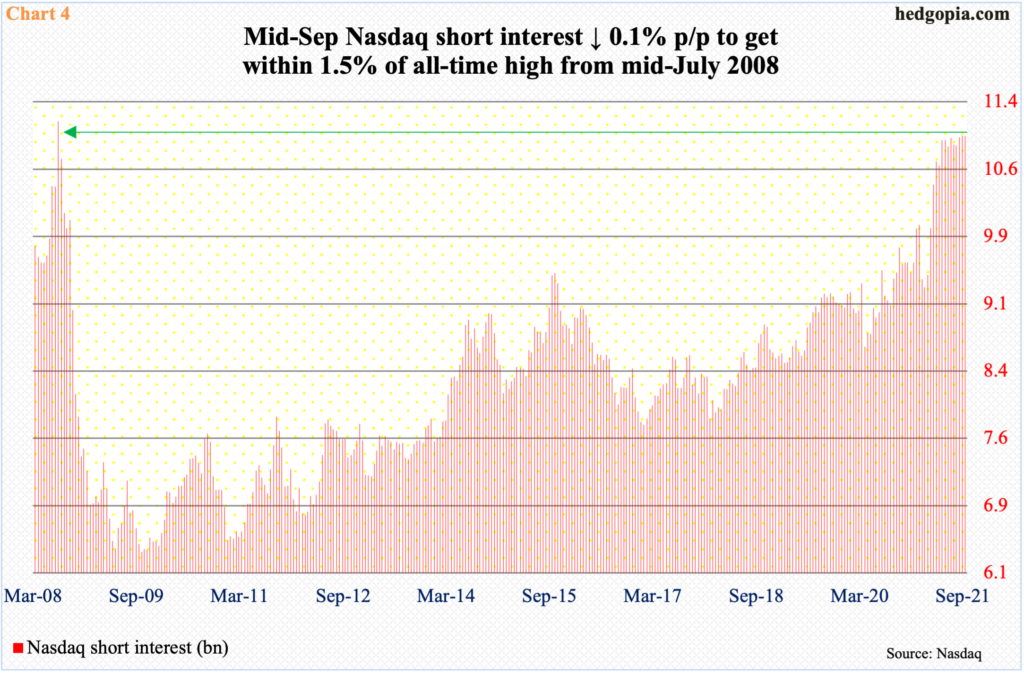
On the Nasdaq Composite (COMP) in particular, short interest remains way elevated. Mid-September, it edged lower 0.1 percent period-over-period to 11 billion. This was the second straight period short interest remained above that threshold. Prior to this, it remained north of 10 billion for five months in a row (Chart 4).
This is unlike how the metric behaved in 2008 when short interest hit 11.2 billion mid-July but only to then come under sustained pressure. As did the S&P 500, the Nasdaq peaked in October 2007; short interest was in the eight billion range back then. As stocks unraveled, shorts kept pressing, until the mid-July peak. They began to cover, and the index bottomed in October 2008, before pretty much going sideways to put in a final bottom in March 2009.
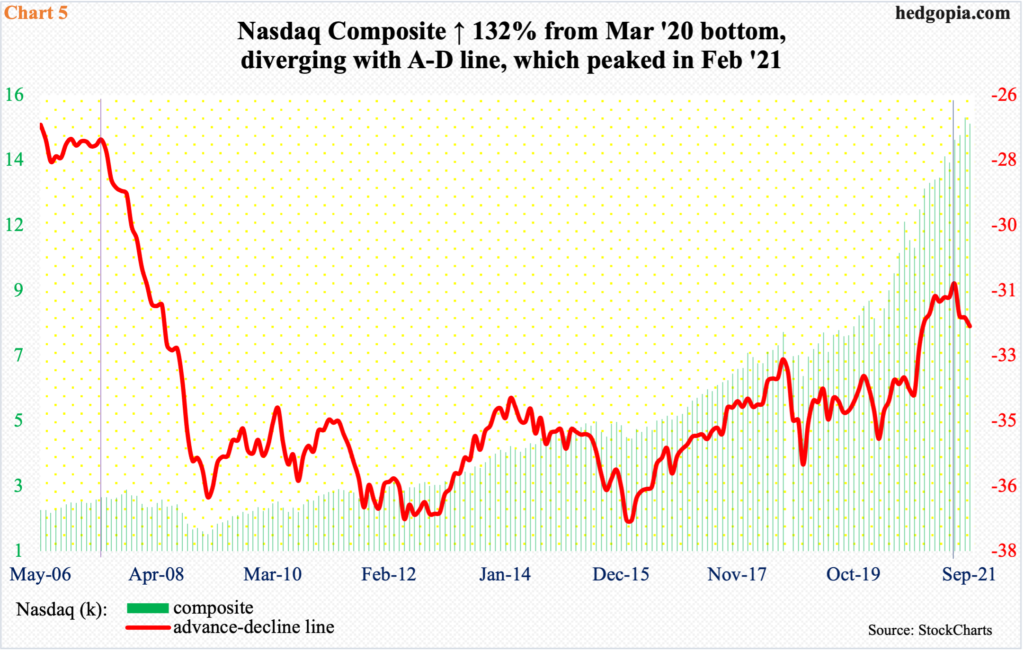
This time around, shorts have been adding even as the Nasdaq (QQQ) persists higher. Just from the March 2020 bottom through the September 7 all-time high of 15403, it surged 132 percent. Short interest was 8.6 billion at the end of March 2020.
Shorts are hurting, but they are staying put. They smelled a little bit of success this month as the Nasdaq fell 5.7 percent from high to low. However, last Monday’s intraday low of 14530 was used as an opportunity to buy; from down 3.4 percent at that session’s low, the index reversed to end the week flat.
This is taking place even as the advance-decline line is diverging, having peaked as early as February this year, with a lower high in June (Chart 5). Tech bulls hope things do not evolve similar to 2007 when the metric sustained lower beginning June, even as the Nasdaq 100 did not peak until October that year.
Equity bulls should also like the fact that markets took last week’s FOMC meeting well. Stocks recovered the early losses, and bonds sold off, with the 10-year treasury yield up nine basis points (SPTL).
The reaction came even amidst the knowledge that rates may rise sooner than expected. The 18-person FOMC was evenly split on the prospects for a rate hike next year. Chair Jerome Powell also set the stage for a tapering announcement in November.
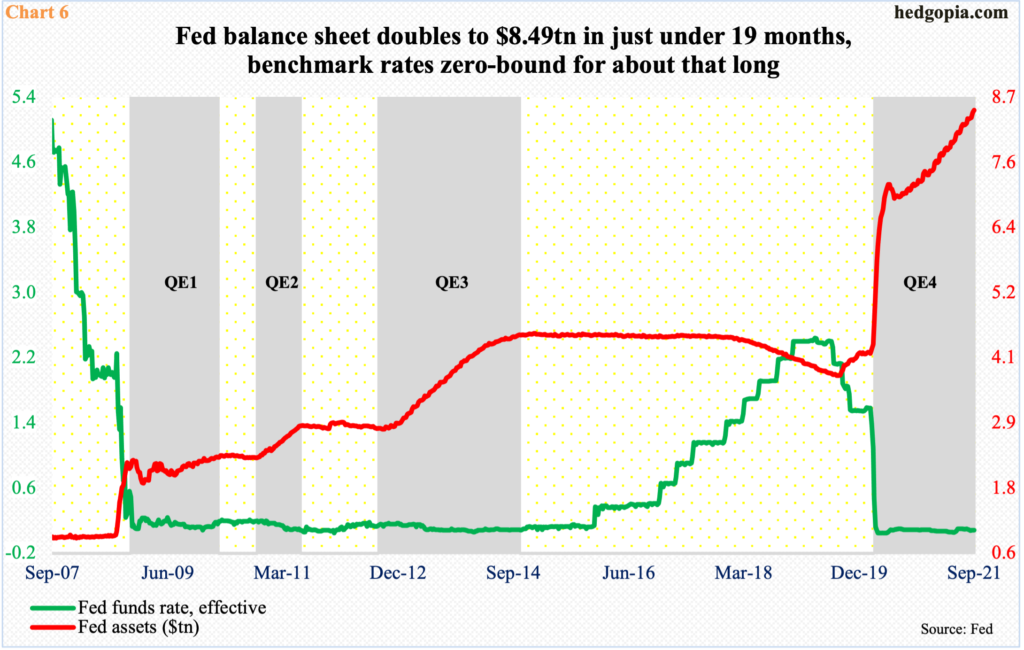
The Fed buys up to $120 billion a month in treasury notes and bonds and in mortgage-backed securities. They intend to end the program around the second half of next year. The balance sheet has doubled from $4.24 trillion in early March last year to $8.49 trillion. The fed funds rate has remained zero-bound from around that time (Chart 6).
So, for markets to take the tapering/tightening news in stride speaks volumes of the prevailing sentiment. The only question is that of sustainability.
Grated the Fed is playing with a small window to roll back stimulus, a rollback is a rollback. This can act as a headwind the same way it acted as a tailwind when it was rolled out.
This is coming at a time when the US economy is showing signs of softening. The Atlanta Fed’s GDPNow model is forecasting a 3.7-percent real GDP growth in 3Q; a month ago, it was forecasting growth of over six percent.
Post-FOMC meeting, the Fed itself downgraded its growth forecast for the year.
This will have implications for earnings growth.
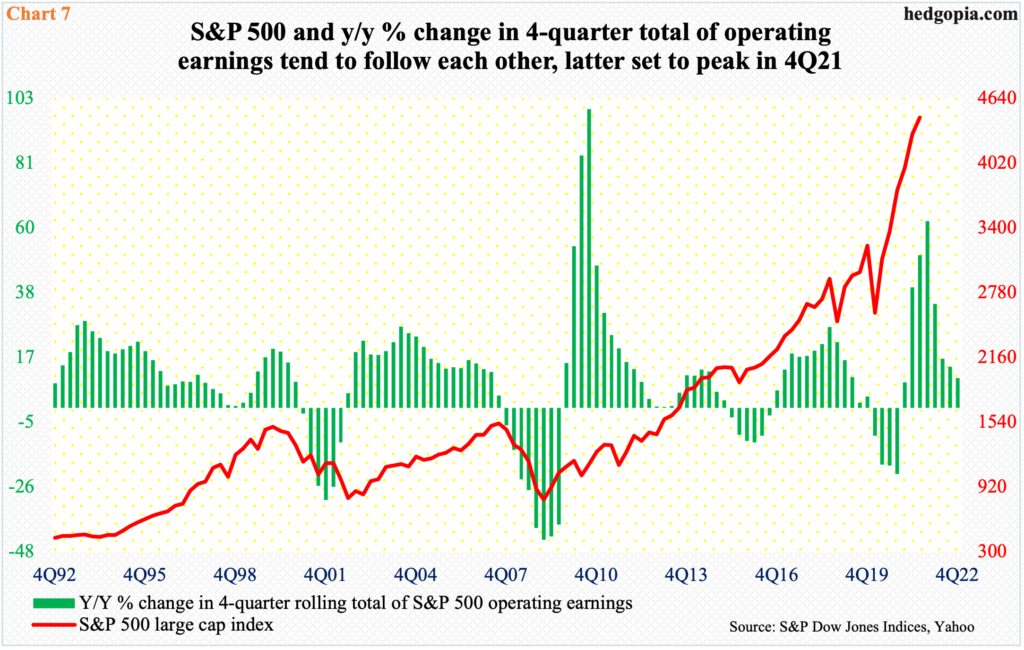
As of last Wednesday, operating earnings estimates for S&P 500 companies fell $0.35 week-over-week to $217.69, for growth of 9.8 percent from this year’s expected $198.32. If earnings come in as expected in the second half, earnings would have grown 62 percent this year.
At the same time, the growth rate is in sharp deceleration, set to peak in 4Q this year, using a four-quarter total (Chart 7). Historically, the S&P 500 has shown a tendency to follow this higher or lower. It is worth watching.
Thanks for reading!
Disclaimer: This article is not intended to be, nor shall it be construed as investment advice. Neither the information nor any opinion expressed here constitutes an offer to buy or sell any ...
more


