
The FHFA and Case Shiller repeat sales indexes are the last home sales and price data for the month.
Two months ago I wrote that
“for the next seven months the comparisons will be against an average 0.7% increase per month in 2023. Because house price indexes have shown a demonstrated lead over shelter costs as measured in the CPI, if present trends continue, as these YoY comparisons drop out, the YoY deceleration in OER in the CPI index should continue towards its more typical rate of between 2.5% to 4% YoY in the ten years before the pandemic.” Last month I reiterated that “I continue to believe that CPI for shelter will continue to decelerate on a YoY basis, but more slowly than before.”
Both of those trends were burned out with this month’s release for repeat sales through March. The FHFA purchase-only price index, after a sharp 1.2% increase in February, only increased 0.1% in March. Meanwhile, the Case Shiller National index rose 0.3%, down from its 0.5% increase in February. Keeping in mind that mortgage rates lead sales, which in turn lead prices, here’s what the monthly numbers look like for the past five years, compared with mortgage rates (red, right scale) averaged monthly:
(Click on image to enlarge)

The relatively big decrease in mortgage rates between last November and this January led to a big increase in sales with an increase in prices as well. As mortgage rates have climbed in the past few months since then, sales have declined somewhat, and prices have started to follow suit.
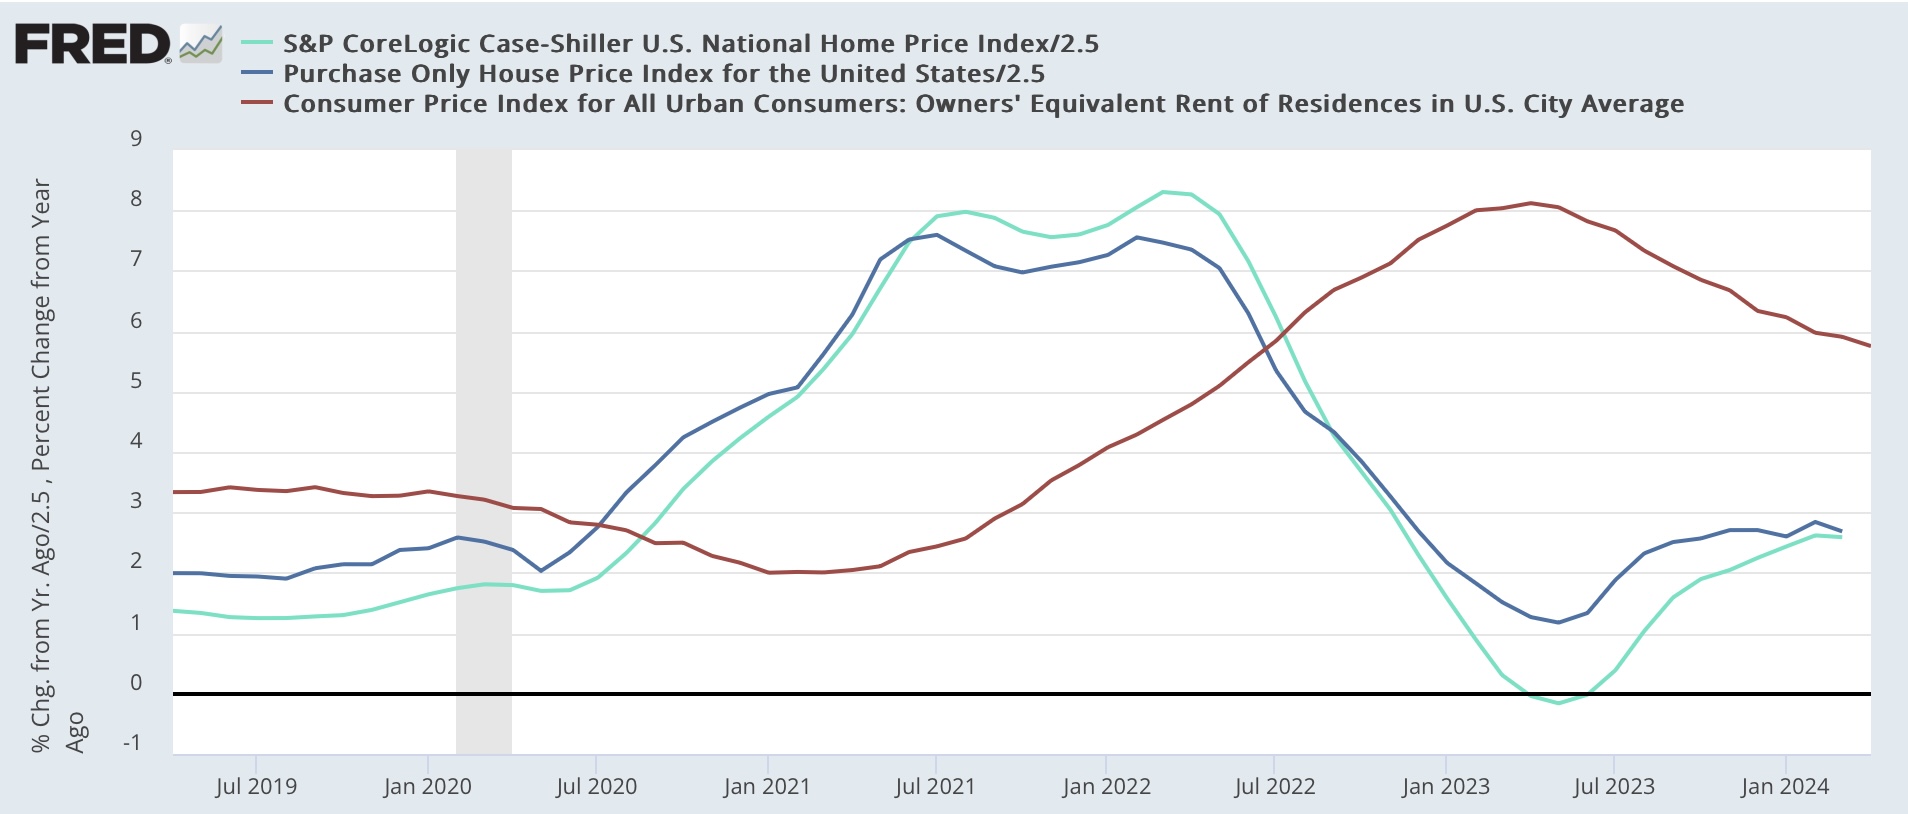
Next, here is the long term YoY graph of both of them below, compared with the CPI for owners’ equivalent rend (red, *2.5 for scale) which continues to show that the YoY gains are actually not out of line compared with gains during the majority of the past 25 years outside of recessions:
(Click on image to enlarge)

Here’s the close-up view of the last five years, better to show the current trend in both prices and shelter inflation for owners:
(Click on image to enlarge)
On a YoY basis, the FHFA index decelerated from a 7.0% increase to 6.7%. The Case Shiller Index declined by less than -0.1% so rounded to an unchanged 6.5% YoY increase. Since the FHFA has had a historical tendency to lead the Case Shiller data by one month, I generally pt a little more weight on that index.
The bottom line remains that there has been no significant YoY acceleration in the FHFA repeat sales index for the past six months, and appreciation in the Case Shiller Index has likely halted, with a lag, as well. Because, as I wrote at the outset, the next five months data will be compared with 0.7% average monthly gains last year (as you can see from the first graph above), I expect the YoY comparisons to show renewed deceleration, which will ultimately - with a decided lag - show up in the shelter component of CPI as well.
Finally, remember that these are all existing home sales, which have been severely constrained by homeowners being locked into the golden handcuffs of 3% mortgages. With limited inventory on the market, there is more compateition among potential buyers moving up from rentals, and thus there is more price appreciation than would normally be the case.
More By This Author:
Real disposable personal income per capita is also hoisting a yellow caution flagNew Home Sales: All Of The Shoes Have Dropped Except One . . .
After A Two Week Excursion, Initial Claims Fall Back Into Range; The “Quick And Dirty” Forecast Model Stays Positive


Comments
Log in or sign up to join the conversation.