

Image Source: Pexels
Including Philadelphia Fed early benchmark, released today. Several series are below recent peaks, including the early benchmark.
(Click on image to enlarge)
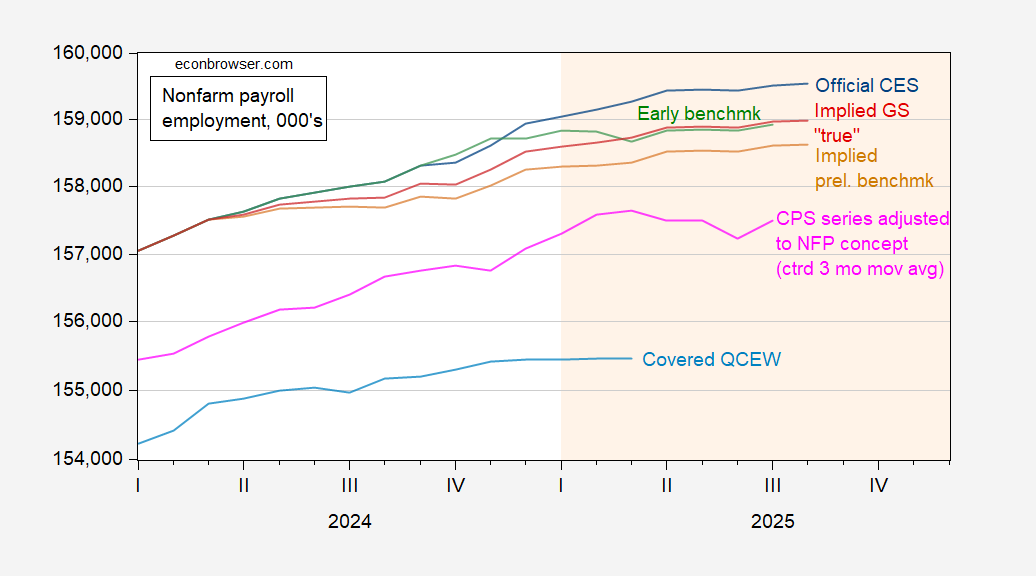
Figure 1: CES Nonfarm payroll (NFP) employment (blue), implied preliminary benchmark (tan), early benchmark (green), implied GS final benchmark (red), CPS series adjusted to NFP concept, 3 month centered moving average (pink), and covered QCEW total employment, seasonally adjusted by author using X-13 (light blue), all in 000’s, s.a. Implied preliminary benchmarks calculated by wedging in the revision between 2024M03 to 2025M03. Source: BLS, Philadelphia Fed, Goldman Sachs, and author’s calculations.
More By This Author:
Stephen Moore Remains Blithely Detached From Reality: Tax Cut ImpactCivilian Employment Peaked In April 2025
One Of These Is Not Like The Others – Messages From The FOMC Sep


Comments
Log in or sign up to join the conversation.