
Following futures positions of non-commercials are as of February 13, 2024.
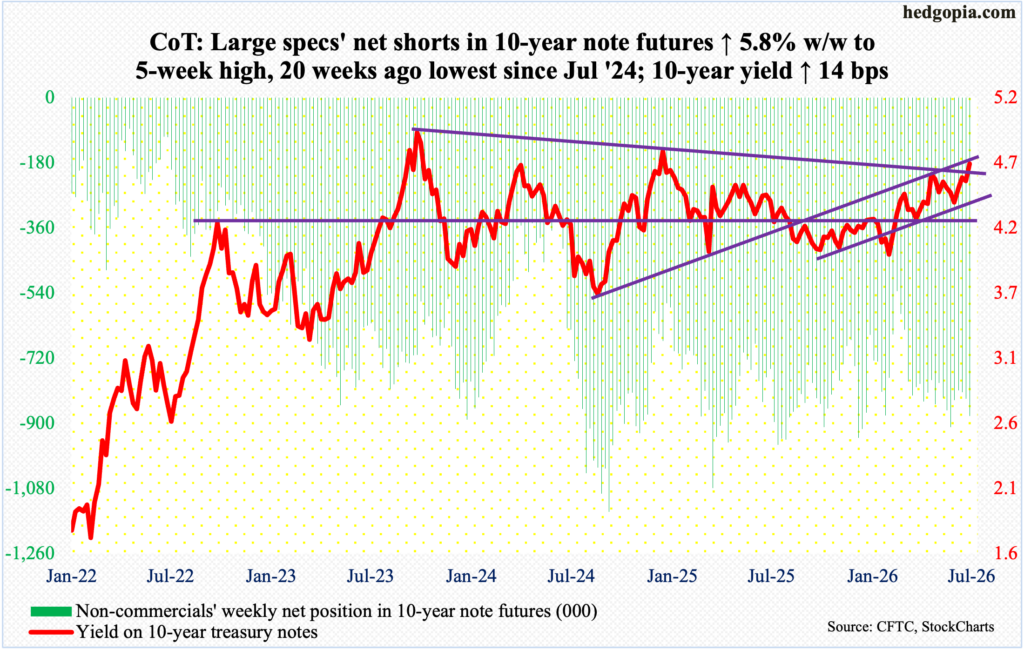
10-year note: Currently net short 760.5k, down 67.9k.
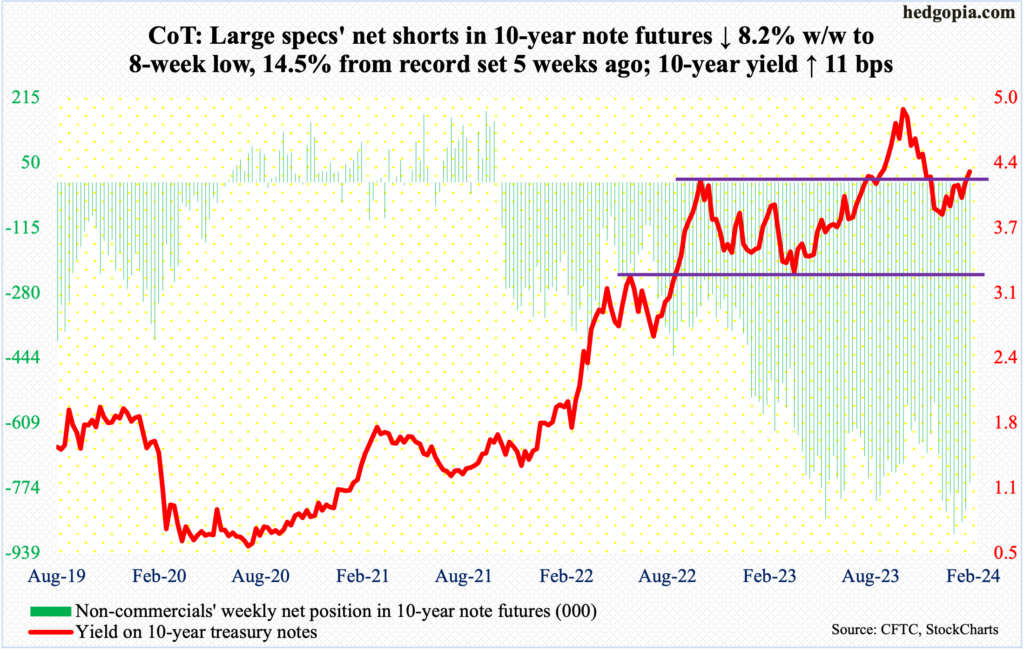
FOMC minutes for the January 30-31 meeting are due out Wednesday. The policy-making body stood pat at that meeting, with the last hike taking place last July when the fed funds rate was hiked by 25 basis points to a range of 525 basis points to 550 basis points. In March 2022, the benchmark rates were between zero and 25 basis points.
Presumably, the minutes are not likely to contain any market-moving information. At the December meeting, the dot plot telegraphed three possible cuts this year. In contrast, futures traders at one point were demanding six to seven cuts, which FOMC officials constantly held out against.
This week, January’s CPI (consumer price index) and PPI (producer price index) came in hotter than expected. PPI does not get as much attention, but if businesses persistently pay high prices, impacting their margins, they will have to sooner or later pass the cost on to the consumer. The futures traders reacted to these reports by adjusting their rates outlook downward to four cuts, with the fed funds rate reaching 425 basis points to 450 basis points by December.
The dot plot-futures traders gap has now shrunk to just one. Concurrently, economic data points have persistently surprised to the upside, leading to even more hawkish language from several FOMC members.
With this as a background, the March 19-20 meeting will be especially important, with the markets currently giving a zero chance for the dot plot to signal two cuts this year, down from December’s three. Last September, the members did expect two cuts this year.
30-year bond: Currently net short 113.4k, down 29.4k.

Major US economic releases for next week are as follows.
Markets are closed Monday for observance of Presidents’ Day.
Existing home sales (January) are due out Thursday. December sales weakened one percent month-over-month to a seasonally adjusted annual rate of 3.78 million units. Sales declined 6.2 percent from a year ago.
WTI crude oil: Currently net long 209.6k, up 17.7k.
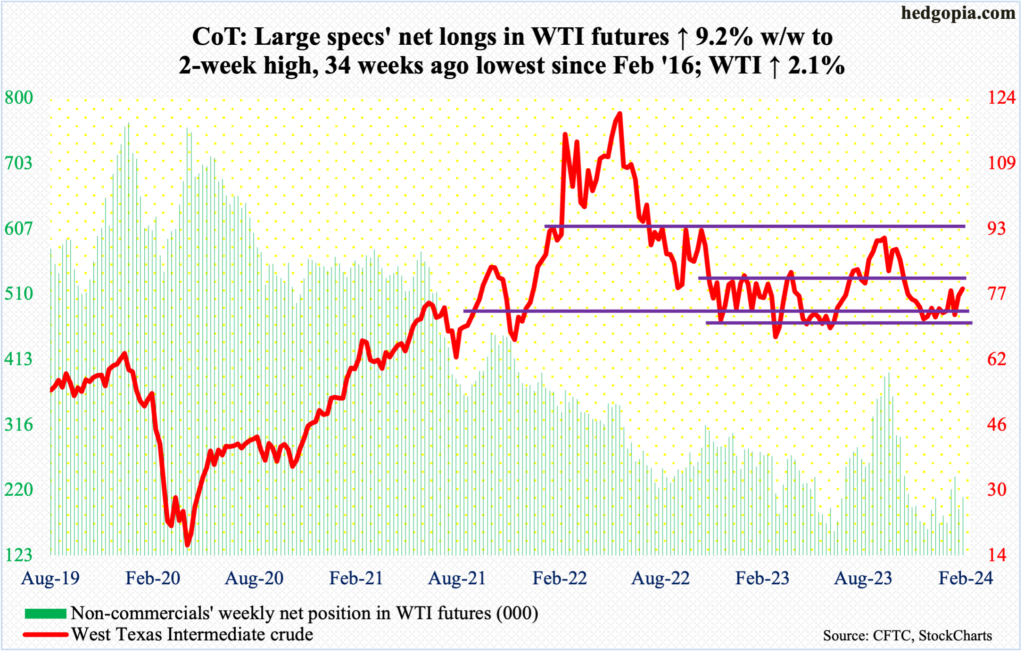
On December 13th – the day the Fed made a dovish pivot – West Texas Intermediate crude bottomed at $67.71, which approximated an intraday low of $67.05 posted in June. After the June low, the crude rallied all the way to $95.03 through September.
Once it bottomed in December, WTI has been making higher lows, with last week’s low of $71.41 defending the lower bound of a 14-month range between $71-$72 and $81-$82.
This week, the crude ($78.46/barrel) poked its head out of the 200-day ($77.41); the average stopped rally attempts going back three months. This time around, WTI has a decent chance of staying above the 200-day and then head toward $80, where it has struggled the past three months. Should things evolve this way, the door opens up to at least the upper bound of the range.
In the meantime, as per the EIA, US crude production in the week to February 9th was unchanged week-over-week at 13.3 million barrels per day. This is a record and was first hit in the week to December 15th, then four more times after that. Crude imports decreased 437,000 b/d to 6.5 mb/d. Gasoline and distillate inventory also declined – down 3.7 million barrels and 1.9 million barrels respectively to 247.3 million barrels and 125.7 million barrels. Crude stocks, on the other hand, increased 12 million barrels to 439.5 million barrels. Refinery utilization dropped 1.8 percentage points to 80.6 percent.
E-mini S&P 500: Currently net short 215.8k, down 17.2k.
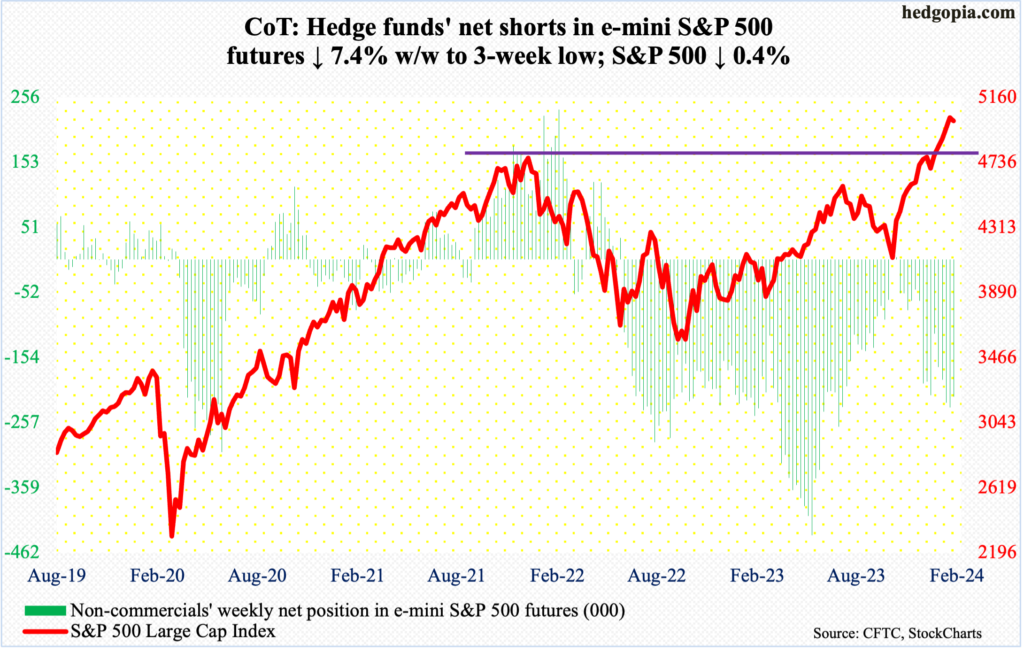
Post-CPI, equity bears had an opportunity this week to wrest control of short-term momentum, but the bulls would not let them (more on this here). The week began with Monday’s shooting-star reversal in which the S&P 500 ticked 5048 and retreated. This was followed by Tuesday’s gap-down, dropping as low as 4920 – just above the 20-day at the time – and the weakness was bought. By Thursday, the gap was filled, with Friday tagging 5039 but reversing lower to end the week down 0.4 percent to 5006.
This was the first down week in six – and the second in 16. This is an opening for the bears. The large cap index has remained overbought for a while now, but a genuine unwinding of these conditions is yet to begin. Shorter-term averages are still rising, which the bulls will try to defend for sure. Their mettle will be genuinely tested when they will be defending breakout retest at 4810s. On January 19th, the S&P 500 pushed through the January 2022 high of 4819.
Euro: Currently net long 52.8k, down 9.3k.
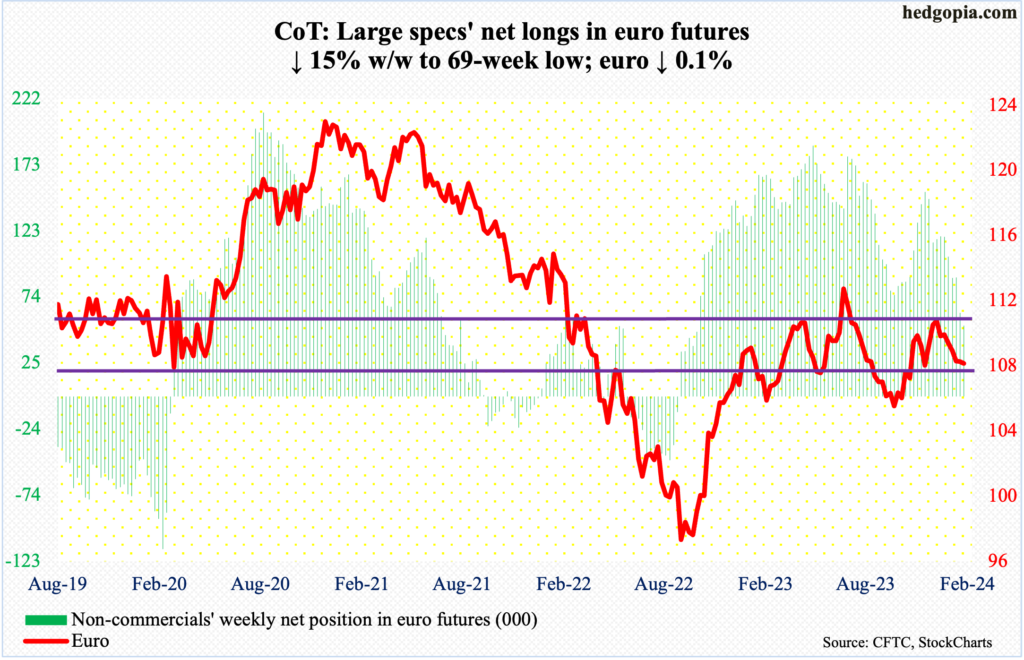
For at least going back to March 2015, $1.07-$1.08 has attracted both bulls and bears. The duel is on currently.
Last week, the euro tagged $1.0741 intraweek to close at $1.0783. This week, it ticked $1.0701 intraday Tuesday before recovering to end the week down 0.1 percent to $1.0775.
The currency has been under pressure since peaking at $1.1125 on December 27th. Odds favor the $1.07-$1.08 holds for now.
Gold: Currently net long 131.2k, down 30.6k.

Non-commercials cut net longs in gold futures to a 17-week low. They started cutting after raising their holdings to 207,718 contracts in the week to December 27th. Earlier on December 4th, gold posted a new intraday high of $2,152 but reversed to close the session at $2,042. This was yet another failure to bust out of $2,080s.
In August 2020, the metal posted a new all-time high of $2,089 and retreated. The reversal occurred again in March 2022 when it printed $2,079 and in May last year when $2,085 was tagged, followed by rejection in late December and early January.
Repeated failed attempts at $2,080s have led non-commercials to lose patience. This week, they cut their holdings to 131,168 contracts.
Amidst this, the daily is trying to stabilize between the 200-day ($1,980) and the 50-day ($2,038). Gold closed this week at $2,024/ounce. A rally looks imminent.
Nasdaq (mini): Currently net long 32.1k, down 812.
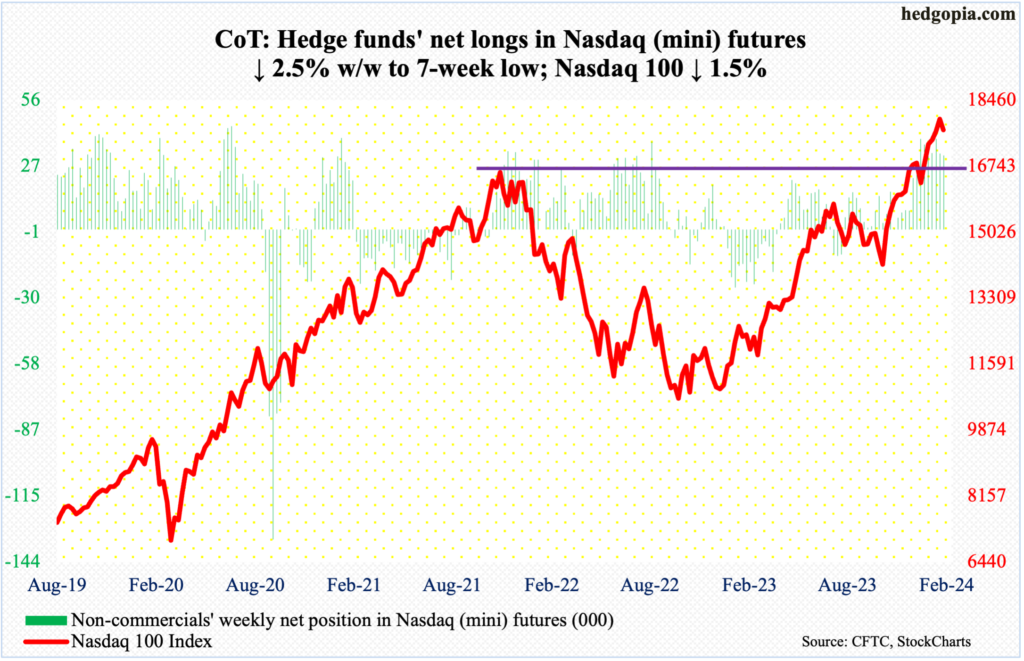
Like the S&P 500, the Nasdaq 100 this week printed a new all-time high but only to then reverse to end the week lower. The tech-heavy index tagged 18041 intraday Monday but finished the week down 1.5 percent to 17686. This was the first down week in six – and the second in 16.
Monday’s intraday reversal also came at the daily upper Bollinger band; the lower bound lies at 17185, with the 50-day just underneath at 17007. This is the risk tech bulls face for now.
Russell 2000 mini-index: Currently net short 24.5k, up 4.5k.

The Russell 2000 did indeed rally toward the December 27th high of 2072 but small-cap bulls were unable to cling on to it. On Thursday, the index touched 2063 intraday; by Friday’s close, it reached 2033, up 1.1 percent for the week.
Earlier on December 13th, the small cap index broke out of a 200-point range between 1900 and 1700, which had been in place since January last year. A measured-move target of the breakout would translate to 2100.
It is possible the Russell 2000 once again goes after 2060s-2070s in the sessions ahead – even 2100 in the best of circumstances – but rallying past the resistance will prove difficult. If anything, 4Q earnings are coming in weaker than expected (more on this here).
US Dollar Index: Currently net long 2k, up 463.
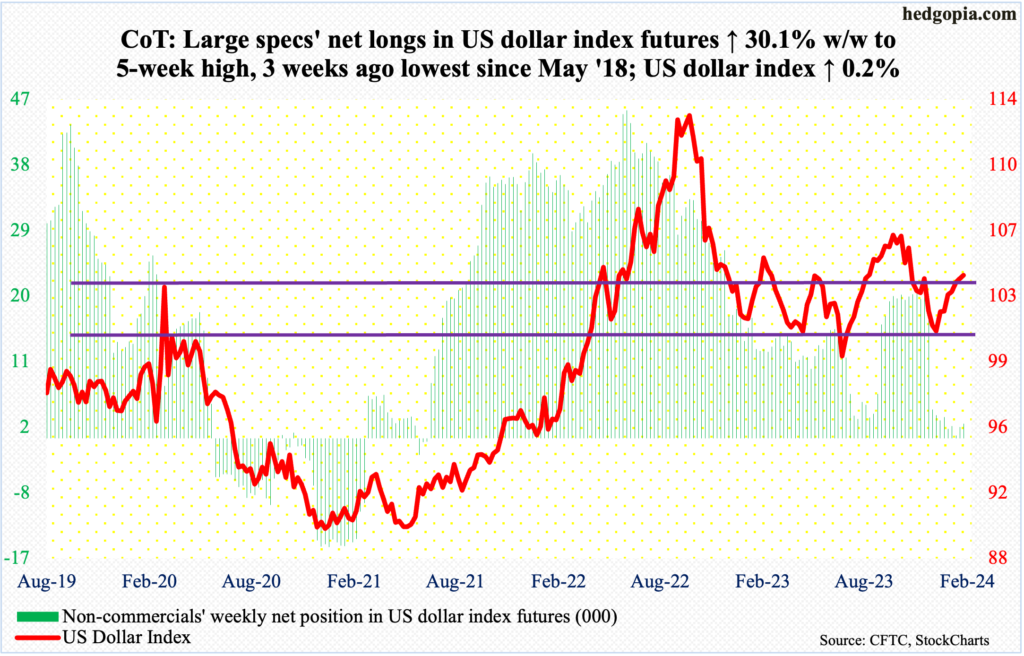
The US dollar index was merely up 0.2 percent this week, but this was enough for a seventh consecutive up week. It bottomed at 100.32 on December 28th.
Earlier, the index peaked on October 3rd at 107.05 and began to really come under pressure early November. Post-Fed pivot on December 13th, it sliced through horizontal support at 103-104. It has made a return trip to that level.
This week, the index closed at 104.18. Odds favor it weakens in the weeks ahead. The most recent weekly candles – a spinning top this week and a shooting star last week – suggest sellers are beginning to come out of the woodwork.
VIX: Currently net short 51k, up 2k.
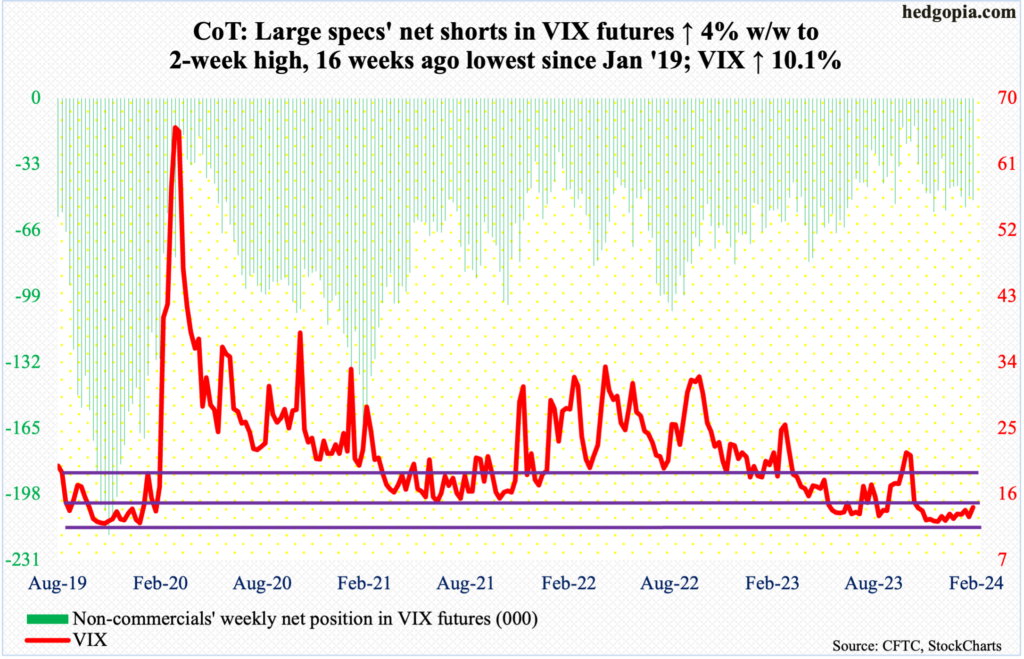
The weekly RSI closed this week at 49.16. For a while now, momentum has struggled to rally past the median. Even if that happens, there is immense resistance at the low-60s.
That said, volatility bulls are looking at a decent opportunity to rally here.
Coming into this week, VIX has had a streak of higher lows since December 12th when it tagged 11.81 intraday. This week, in the wake of Tuesday’s CPI, the volatility index surged to 17.94 intraday but only to then leave behind a long upper wick to close the session at 15.85. By the end of the week, it closed at 14.24.
The weekly in particular looks ready to firm up, with a bullish MACD crossover this week.
Thanks for reading!
More By This Author:
Way Overbought US Equity Indices Used January’s CPI Report As Excuse To Weaken
4Q Small-Cap Earnings Coming In Weak, Sell-Side Expects Blockbuster 2024, But Russell 2000 Fails To Agree
Mining This Week's CoT Report - Via Futures, What Commercials & Noncommercials Are Buying


Comments
Log in or sign up to join the conversation.