
Semi-Good Week
The S&P 500 is entering the last day of June with a year-to-date gain of just over 15%.
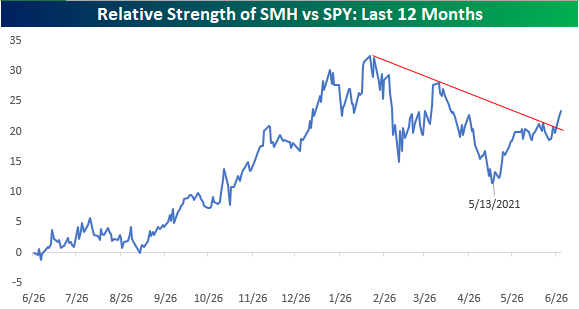
In a post yesterday, we noted the breakout to new highs in the semiconductor sector after a four-month period of consolidation. On a relative strength basis, the sector has also picked up the pace over the last six weeks. The chart below shows the relative strength of the Semiconductor ETF (SMH) versus SPY over the last year. SMH's peak on a relative basis began in mid-February just when the sector's trading range peaked. For the next three months, the sector significantly underperformed the S&P 500, and it wasn't until May 13th - the day after the April CPI report - that the sector's underperformance troughed. Since then, semis have bounced back in a big way, and over the last two trading days have finally broken the downtrend that has been in place since that mid-February peak. New highs and a broken downtrend? It's been a big week for semis.
Disclaimer: For more global markets and macroeconomic coverage, make sure to check out Bespoke’s Morning Lineup and nightly Closer notes, as well as our ...
more

