
Russell Falls Apart
While the rest of the market was rallying and holding up, the Russell has been struggling for close to a month now. After peaking above its 50-DMA back on 2/25, the Russell has had a hard time holding onto any gains lately. Earlier this week it made a lower high when the rest of the market was making higher highs, and to close out the week, it declined 3.6% for its worst day of 2019, making a lower low. Not a pretty chart at all.
(Click on image to enlarge)

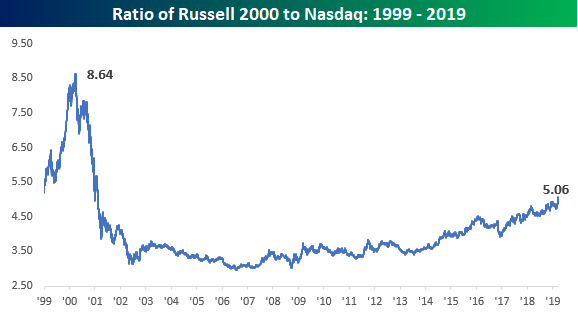
The Russell’s underperformance can really be seen in the ratio of the Nasdaq to the Russell 2000. This week, the ratio between its price and the Rusell 2000 really become unglued, topping 5 for the first time since February 2001.
(Click on image to enlarge)

On a longer-term basis, the only time the Nasdaq has been outperforming the Russell 2000 by such a wide margin was during the period from November 1998 through February 2001. And if you think the ratio is extreme now, during that period it got as high as 8.64 on March 28, 2000.In order for the ratio to get to that sort of extreme now, the Nasdaq would need to top 13,000 (assuming the Russell remained at the same level.
(Click on image to enlarge)
Disclaimer: To begin receiving both our technical and fundamental analysis of the natural gas market on a daily basis, and view our various models breaking down weather by natural gas demand ...
more
Comments
 No Thumbs up yet!

