
'Risk On' Firms Up, First Signs Of DXY Weakness
Quick Take
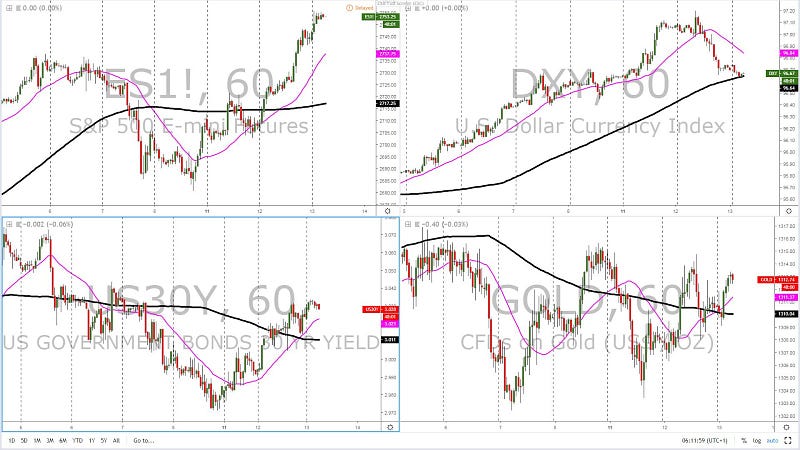
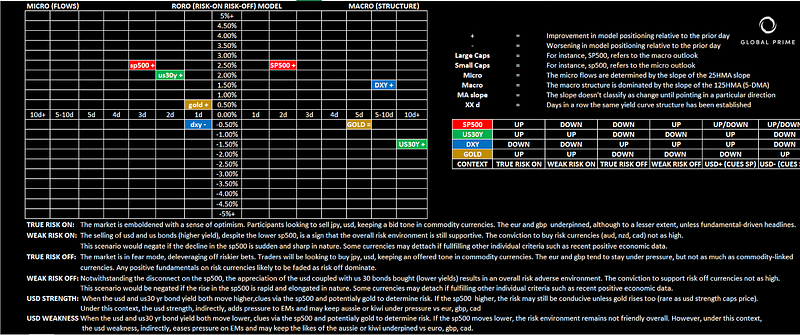
Anyway you slice it, the short term conditions in financial markets have fully transitioned into a blossoming state, with the environment characterized by ‘true risk-on’ as depicted by the surge in US equities coupled with further supply in US bonds (higher yields). To top it off, the USD has finally caved in to the ebullient mood by finding a wave of selling pressure, which makes the short-term context one of full-blown risk appetite mood.
From a longer-term perspective, using the 5-DMA as a reference, further adjustments in structures must still eventuate before we can synchronize microflows with the macrostructure. A clear reminder of how fragile the macro outlook still looks, even if less so than 24h ago, is the prolonged bull flattening yield curves in developed countries. Near term, a tentative recovery is in the making as risk recovers and with it, the short-term formations of bear-steepeners, which translates into the prospects of an improved growth outlook down the road as long-dated yields rise faster than short-dated.
What this means in FX is that the short-term flows do suggest a more constructive outlook towards beta currencies the likes of the Aussie, Canadian Dollar, Kiwi (overstretched today). The JPY should continue to struggle in finding much demand amid the current dynamics in place. In this intersection, one can imagine that Oil prices will fare fairly well. The Euro looks technically better positioned than its been for the last 2 weeks to eke out further gains after a sizeable bullish outside day, while the Sterling is the only “?” failing to capitalize on USD weakness due to the Brexit uncertainties.
Narrative In Financial Markets
- Markets latched on to the positive rhetoric in the Sino-US trade talks, with prospects of US President Trump skipping March 1st tariff hikes deadline if a ‘real deal” is in the making.
- The risk sentiment has been further boosted in Asia as reputable sources suggest China’s President Xi is planning to meet the US delegation currently in China later this week.
- Increasing likelihood that a border security funding agreement will eventuate that will prevent the US from shutting down its government again, with the deadline for this Friday. The political cost for Trump does not allow for another ‘shutdown’ drama.
- The RBNZ keeps rates unchanged and the NZD soars as the New Zealand Central Bank does not telegraph an easing of its narrative. The yield curve tells us the RBNZ is making a policy mistake but Governor Orr is not yet blinking to the global deceleration in growth.
- The USD loses big against the EUR in the first signs of a turnaround in fortunes for the single-currency, as the USD pares back its largest win run since mid 2016.
- In a speech in Michigan to University students, US Federal Reserve Chairman Powell said that recession risk is ‘not elevated’.
- BoE Governor Carney calls for clarity over Brexit, noting that the latest contraction in Dec GDP shows “the importance of deciding a transition to whatever end-state parliament decides.”
Potential Drivers — Economic Calendar
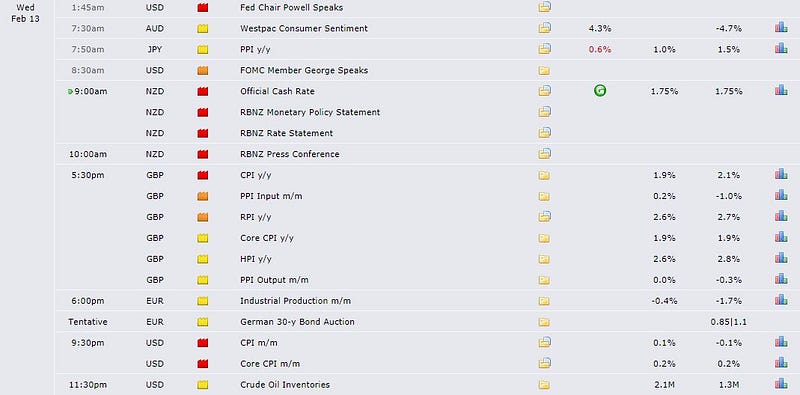
Source: Forexfactory
RORO Model: Risk-On Risk-Off Conditions
Yield Curve: Outlook For Growth, Inflation & Policies
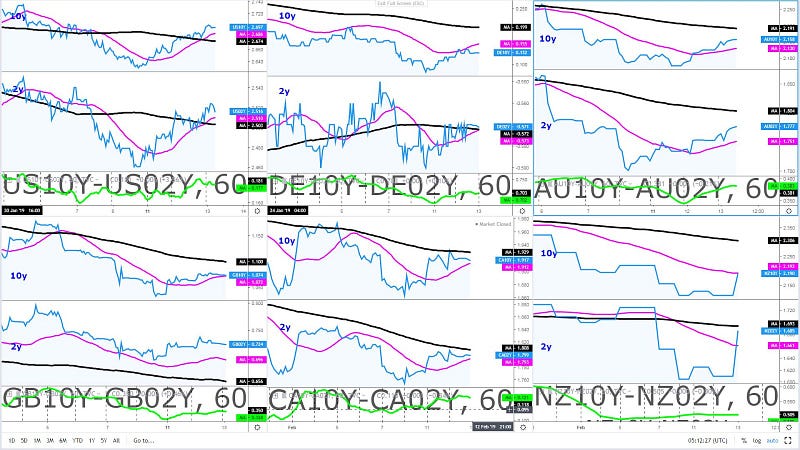
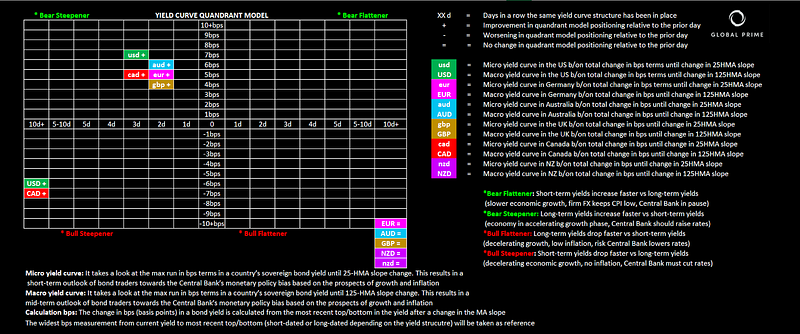
Chart Insights: Technicals & Intermarket Analysis
EUR/USD: Bullish Outside Day At Critical Support
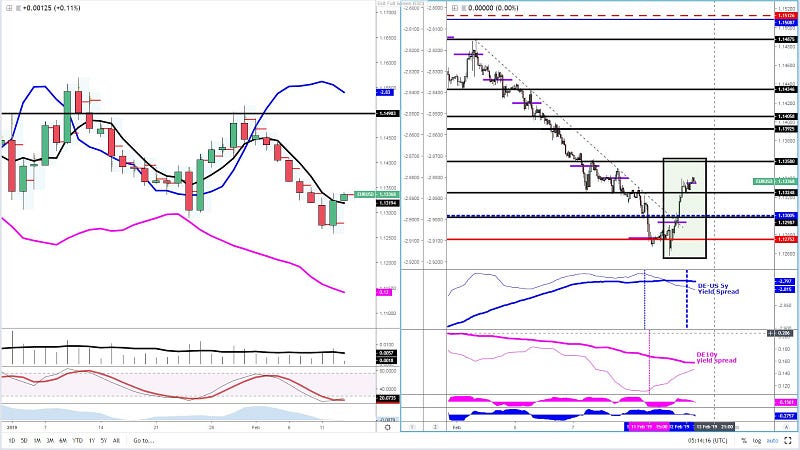
The pair has seen a vigorous rebound off a major liquidity area sub 1.13, which represents a weekly horizontal level as depicted by the red horizontal line. The formation of a bullish outside day is a strong testament that the order flow has suddenly shifted into a more convincing buy on dips mentality. I must say it’s been very hard to read the intraday correlations in the EUR/USD, as the price has been for most of February in total disconnect with its historically reliable German-US 5-yr yield spread, to instead follow much more tightly the German 10-yr bond yield performance. Under this premise, the improvement in the German yield over the last 2 days as the risk-on picks up, alongside the existing macro divergence in the yield spread vs the US, were factors posing a major challenge to see further follow through beyond critical levels of liquidity sub 1.13. The impulsiveness of the rebound alongside the magnitude (move worth larger than daily ATR) has resulted in the break of a descending trendline, finally aligning correlations and price.
GBP/USD: Tricky Backdrop On Brexit, DXY & Yields Spreads
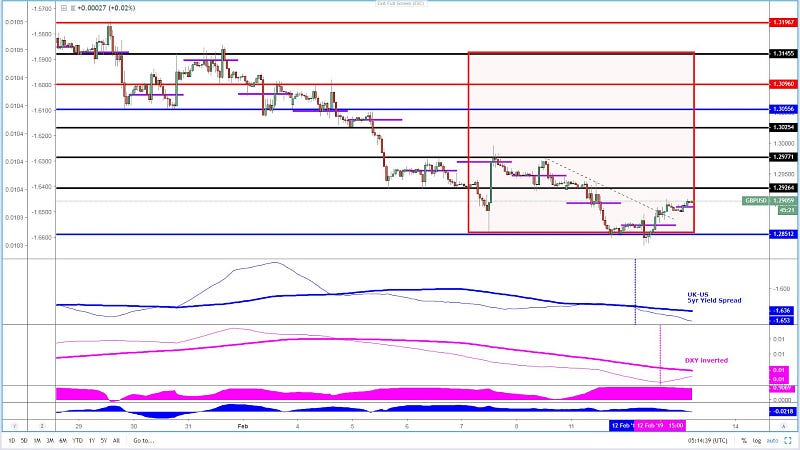
The appreciation in the Sterling has been far more subdued compared to the Euro. The lack of sufficient demand to take the currency through any structural breaking point seems to be a manifestation of the renewed concerns over Brexit, with a hiatus of a few weeks with no real news. The stand-off between the UK and the EU for the former to get further confessions, alongside PM’s May comments, makes the binary outcome of a No-Deal Brexit (Hard Brexit) or a Brexit Extension look more likely, even if the situation is so fluid that over speculation is not what I am here for. Back to the charts, and it’s through that declining micro and macro slope in the UK-US yield spread that matters, as that’s the market communicating their perception towards a positive Brexit resolution, as things stand at the moment, looks quite bleak. The only residual demand the GBP found was via the broad-based weakness in the DXY as the upward slope in the 25-HMA shows (magenta). The pair is far from presenting conditions to engage in either buying or selling, hence why any involvement may turn out to be a fairly complex affair to determine the next direction. As the red box highlight, the pair has been on a sync sell-side bias phase for quite a few days, with the clear bias terminating the moment the slope in the DXY shifted north. Macro-wise, as long as the 25-HMA doesn’t cross the 125-HMA, there is still credence to be constructive for sell-side campaigns at key liquidity levels.
USD/JPY: True Risk-On Depresses JPY Demand
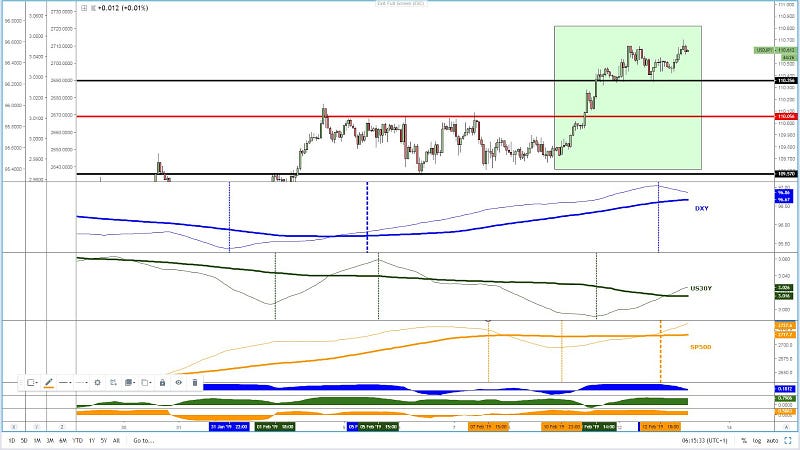
One could argue that ever since the microflows in the SP500 and the DXY alienated back on Feb 8th in the late US session, that was the Intermarket milestone necessary to see the explosion of demand witnessed ever since. I’d personally argue, based on my own preferences, that unless I also see positive microflows in the US yields, I can’t tick all the boxes I’d like to see. That’s more prudence on my side. Anyhow, that was an occurrence that did also materialize on Feb 11th at the US open, allowing the pair to be propped up through the 110.00 round number into 110.60–65, where it’s been stabilizing now. In the last 24h, notwithstanding the loss of slope in the DXY (negative for USD/JPY), the upward micro slopes in the US30Y and the SP500 means the environment remains ‘true risk on’, and as such, this results in further residual demand entering this market even if the DXY weakens. From a macro perspective, while the DXY and the SP500 are both pointing higher, there is still some marginal gains required by US yields to turn its slope upwards even if a cross has already been achieved between the micro and macro lines (25 & 125-HMA). The outlook looks promising.
AUD/USD: Buy-Side Microflows Within Gloomy Macro Outlook
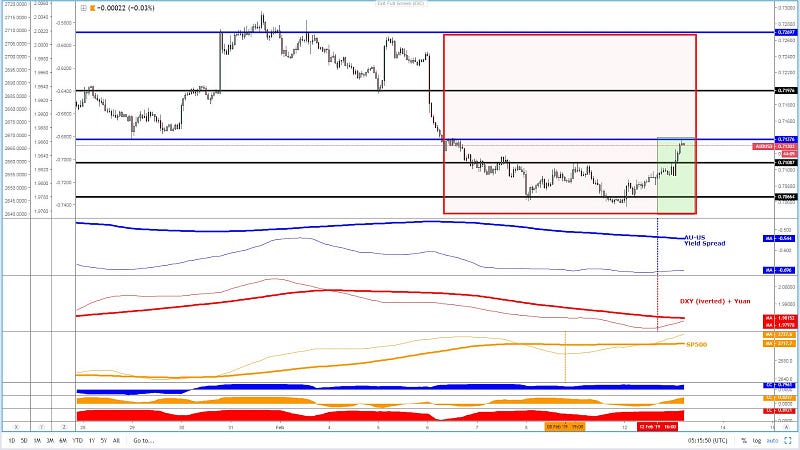
In the early hours of the last US session, buy-side interest in the Aussie started to increase as microflows reverted back into the likes of beta currencies as the upward slopes in the 25-HMA (a proxy for microflows) via the DXY (inverted) / Yuan coupled with the Aus-US yield spread exhibit. Support the upside was the structural shift in the SP500, as both micro and macro flows re-align to bullish. However, as followers of my market coverage know well, the Aussie has been mainly driven by the yield spreads (blue line) and the DXY/Yuan performance (red), that’s why the macro slope (125-HMA) still cast a major shadow for those long-side committed. Such dynamics suggest that the upside should find macro interest at key liquidity intersections such as 0.7120–25 or 0.7145–55. It remains to be seen whether or not the short-term positive flows can overwhelm the macro picture. For now, more work must be done for the macro slopes to also transition into a long bias. That’s why in today’s chart you still see a red box (macro outlook)
Important Footnotes
- Risk model: The fact that financial markets have become so intertwined and dynamic makes it essential to stay constantly in tune with market conditions and adapt to new environments. This prop model will assist you to gauge the context that you are trading so that you can significantly reduce the downside risks. To understand the principles applied in the assessment of this model, refer to the tutorial How to Unpack Risk Sentiment Profiles
- Cycles: Markets evolve in cycles followed by a period of distribution and/or accumulation. The weekly cycles are highlighted in red, blue refers to the daily, while the black lines represent the hourly cycles. To understand the principles applied in the assessment of cycles, refer to the tutorial How To Read Market Structures In Forex
- POC: It refers to the point of control. It represents the areas of most interest by trading volume and should act as walls of bids/offers that may result in price reversals. The volume profile analysis tracks trading activity over a specified time period at specified price levels. The study reveals the constant evolution of the market auction process. If you wish to find out more about the importance of the POC, refer to the tutorial How to Read Volume Profile Structures
- Tick Volume: Price updates activity provides great insights into the actual buy or sell-side commitment to be engaged into a specific directional movement. Studies validate that price updates (tick volume) are highly correlated to actual traded volume, with the correlation being very high, when looking at hourly data. If you wish to find out more about the importance tick volume, refer to the tutorial on Why Is Tick Volume Important To Monitor?
- Horizontal Support/Resistance: Unlike levels of dynamic support or resistance or more subjective measurements such as Fibonacci retracements, pivot points, trendlines, or other forms of reactive areas, the horizontal lines of support and resistance are universal concepts used by the majority of market participants. It, therefore, makes the areas the most widely followed and relevant to monitor. The Ultimate Guide To Identify Areas Of High Interest In Any Market
- Trendlines: Besides the horizontal lines, trendlines are helpful as a visual representation of the trend. The trendlines are drawn respecting a series of rules that determine the validation of a new cycle being created. Therefore, these trendline drawn in the chart hinge to a certain interpretation of market structures.
- Correlations: Each forex pair has a series of highly correlated assets to assess valuations. This type of study is called inter-market analysis and it involves scoping out anomalies in the ever-evolving global interconnectivity between equities, bonds, currencies, and commodities. If you would like to understand more about this concept, refer to the tutorial How Divergence In Correlated Assets Can Help You Add An Edge.
- Fundamentals: It’s important to highlight that the daily market outlook provided in this report is subject to the impact of the fundamental news. Any unexpected news may cause the price to behave erratically in the short term.
- Projection Targets: The usefulness of the 100% projection resides in the symmetry and harmonic relationships of market cycles. By drawing a 100% projection, you can anticipate the area in the chart where some type of pause and potential reversals in price is likely to occur, due to 1. The side in control of the cycle takes profits 2. Counter-trend positions are added by contrarian players 3. These are price points where limit orders are set by market-makers. You can find out more by reading the tutorial on The Magical 100% Fibonacci Projection
The Daily Edge is authored by Ivan Delgado, Head of Market Research at Global Prime. The purpose of this content is to provide an assessment of the market conditions. The report takes an in-depth ...
more
Comments
 No Thumbs up yet!

