
Reflections On Ten Years: Deficits, The Financial Crisis, Textbook Economics And Data Paranoia
Last Saturday marked ten years I’ve had the honor of contributing to Econbrowser, at the generous invitation of Jim Hamilton (here are his thoughts on ten years of Econbrowser). What follows are some thoughts on what I’ve learned during that time.
The current account imbalance was the topic of my first post in September 2005. At the time, I focused on the confluence of an inappropriately expansionary fiscal policy (massive tax cuts and an invasion and occupation) and excessive foreign purchases of US assets. I think the tax cuts did spur the external deficits — and the boom in house prices.
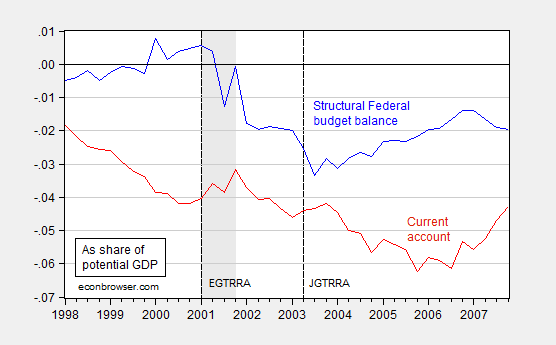
Figure 1: Federal cyclically adjusted budget balance (blue) and current account (red) as a share of potential GDP. NBER defined recession dates shaded gray. Long dashed vertical lines at tax cuts; EGTRRA is Employment and Growth Tax Relief Reconciliation Act, and JGTRRA is the Jobs and Growth Tax Relief Reconciliation Act.
Source: BEA, CBO (January 2015), NBER, author’s calculations.
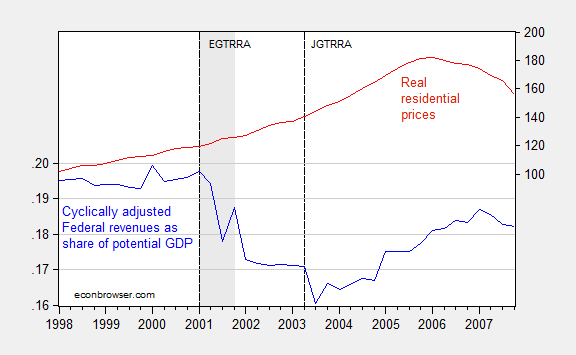
Figure 2: Federal cyclically adjusted revenues as a share of potential GDP (blue, left scale) and real residential prices (red, right log scale). NBER defined recession dates shaded gray. Long dashed vertical lines at tax cuts; EGTRRA is Employment and Growth Tax Relief Reconciliation Act, and JGTRRA is the Jobs and Growth Tax Relief Reconciliation Act.
Source: BEA, CBO (January 2015), NBER, author’s calculations.
Note that the fiscal measures are cyclically adjusted (technically, “without automatic stabilizers” in CBO parlance), so one cannot just say the recession caused the steep decline in the Federal budget balance and revenues. Rather these were policy driven changes. The current account clearly decreases, with a lag, in response to the budget balance.
Turn now to Federal revenues. Since the right scale of Figure 2 has a log scale, then the steepening of the red line represents an acceleration in residential prices (this is a BIS series; using a twenty city Case-Shiller index deflated by CPI yields an even more pronounced acceleration and peak).
Deregulation and financial innovation of course also added to the effect. In retrospect, I should have placed much, much more emphasis on the resulting Akerlof-Romer process of “looting” as a driver of the resulting asset boom, as I did in early 2007. While I was incorrect on how the imbalances would play out in a crisis — I thought the US would experience a dollar crisis, rather than an internal “sudden stop” — I was proved right that the fiscal policies implemented in the mid-2000s were unsustainable, and resulted in a bust of unprecedented proportions.
One worry I expressed in 2006 is that in embarking upon massive tax cuts, the G.W. Bush Administration was constraining future fiscal policy choices. That anxiety proved to be well-founded. Had we had a larger budget surplus – actually just a smaller structural deficit – in 2008, then the American Recovery and Reinvestment Act of 2009 could have been measurably larger, and the suffering endured during the great recession could have been further mitigated. Instead, the legacy of surpluses at the end of the Clinton administration were squandered in exchange for a housing and consumption boom, and a war of choice that cost a trillion dollars just in direct fiscal costs. (See also Lost Decades).
I started out blogging relying equally on my own research on open economy macroeconomics, and on the textbook macroeconomics I teach intermediate level undergraduates. What has surprised me was how well textbook macro worked:
- When the zero lower bound is encountered, fiscal policy is particularly effective (i.e., in a liquidity trap).
- Accommodative monetary policy means that investment crowding out is unlikely (or that investment will be crowded in) by fiscal policy.
- If there is a lot of slack in the economy, increased fiscal and/or monetary stimulus is unlikely to result in high inflation, in the absence of supply side shocks.
These points are highlighted by Figures 3 and 4, showing the change in GDP as a function of the American Recovery and Reinvestment Act (ARRA), and the CBO’s assessment of the impact of the ARRA on the trajectory of the economy.
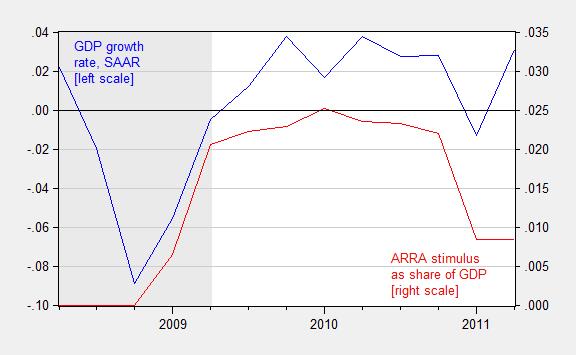
Figure 3: Quarter on quarter growth rate of real GDP, annualized (blue line, left scale) and sum of total receipt effects (reversed) and total expenditure effects from the ARRA, as a share of nominal GDP, 2008Q2-2011Q2. NBER defined recession dates shaded gray. Growth rate calculated as log first difference.
Source: BEA via FRED and BEA 2013Q3 3rd release, NBER, and author’s calculations.
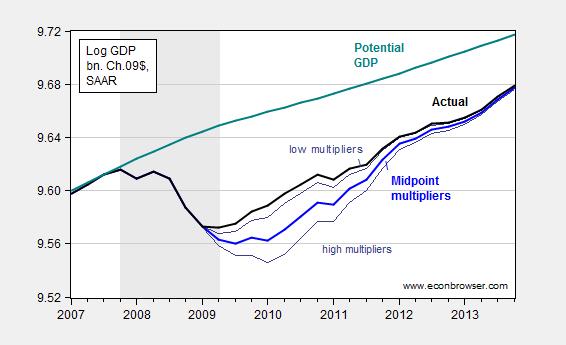
Figure 4: Log actual GDP (black), midpoint of CBO counterfactual of no stimulus (blue), high and low estimates (gray), and CBO estimate of potential GDP (teal), all in billions of Ch.2009$. Estimates presume no monetary policy tightening in response to fiscal stimulus.
Source: BEA 2013Q4 advance release, CBO1, CBO, Budget and Economic Outlook, February 2014, and author’s calculations.
On a related note, I still occasionally hear about expansionary fiscal contractions, despite this correlation:
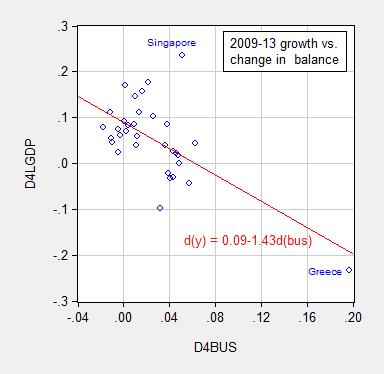
Figure 5: Cumulative growth rate 2009-13 versus cumulative change in cyclically adjusted budget balance as a share of potential GDP, for all advanced countries (IMF WEOdefinition).
Source: IMF, World Economic Outlook database (October 2013).
It has been surprising to me how resistant many people are to these observations. I think, however, this phenomenon is related to the reluctance of some to accept the validity of any given data. Data generated by US government agencies and the international institutions are imperfect; however the critique is much more extreme. The views I have in mind range from those of readers (government manipulates the data generally;CPI is not a valid indicator) to former CEO’s and politicians. When so many think the numbers are manipulated to some nefarious end, it is no wonder that empirical observations carry so little weight in informing thought on how the economy works. Nonetheless, I retain hope that the sheer weight of accumulated evidence can influence people — the fact that we no longer hear about impending hyper-inflation suggests that perhaps the most implausible conjectures are eventually dispelled.
Disclosure: None.


Menzie, you can't slap a libertarian Austrian with enough evidence to keep them from their pet theories. It is an impossible task.