
NBER BCDC key indicators, alternative indicators, and weekly indicators:
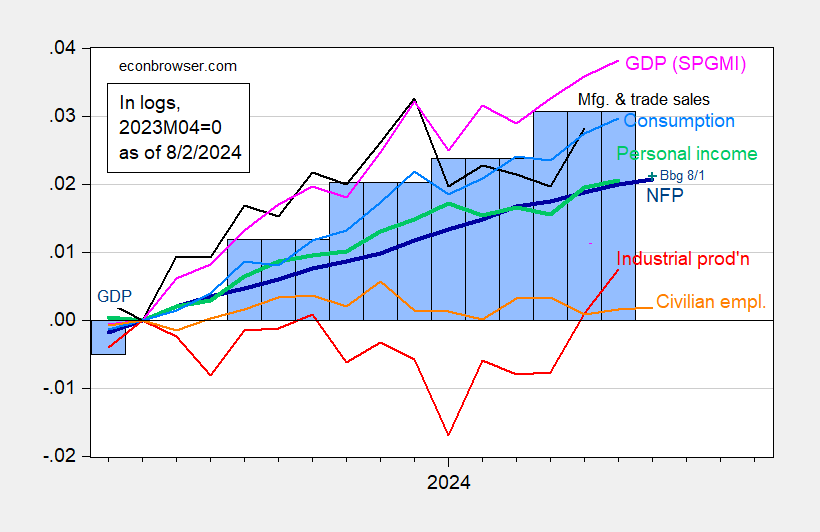
Figure 1: Nonfarm Payroll (NFP) employment from CES (bold blue), civilian employment (orange), industrial production (red), personal income excluding current transfers in Ch.2017$ (bold green), manufacturing and trade sales in Ch.2017$ (black), consumption in Ch.2017$ (light blue), and monthly GDP in Ch.2017$ (pink), GDP (blue bars), all log normalized to 2023M04=0. Source: BLS via FRED, Federal Reserve, BEA 2024Q2 advance release, S&P Global Market Insights (nee Macroeconomic Advisers, IHS Markit) (8/1/2024 release), and author’s calculations.
Some alternative indicators in the same format.
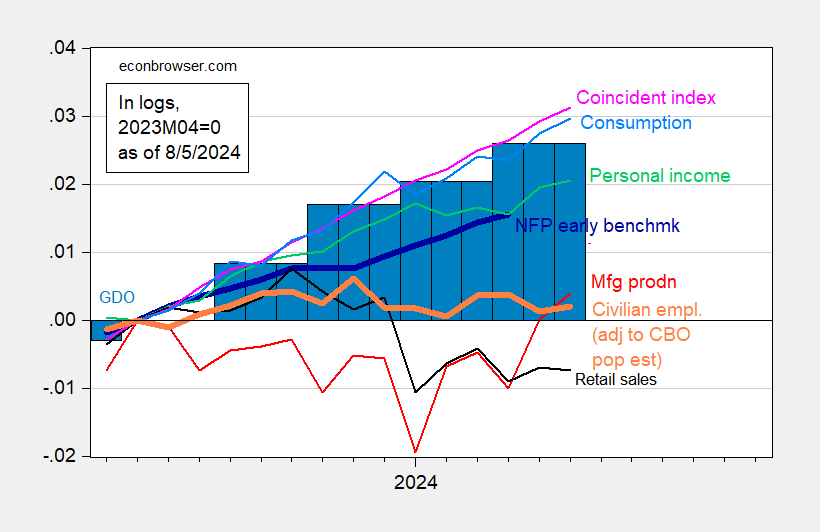
Figure 2: Nonfarm Payroll early benchmark (blue), civilian employment adjusted to CBO estimated immigration (orange), manufacturing production (red), personal income excluding current transfers in Ch.2017$ (bold green), retail sales in 1999M12$ (black), consumption in Ch.2017$ (light blue), and coincident index (pink), GDO (blue bars), all log normalized to 2023M04=0. 2024Q2 GDO uses estimated GDI. Source: BLS via FRED, Federal Reserve, BEA 2024Q2 advance release, Philadelphia Fed, and author’s calculations.
Yet more alternative indicators:
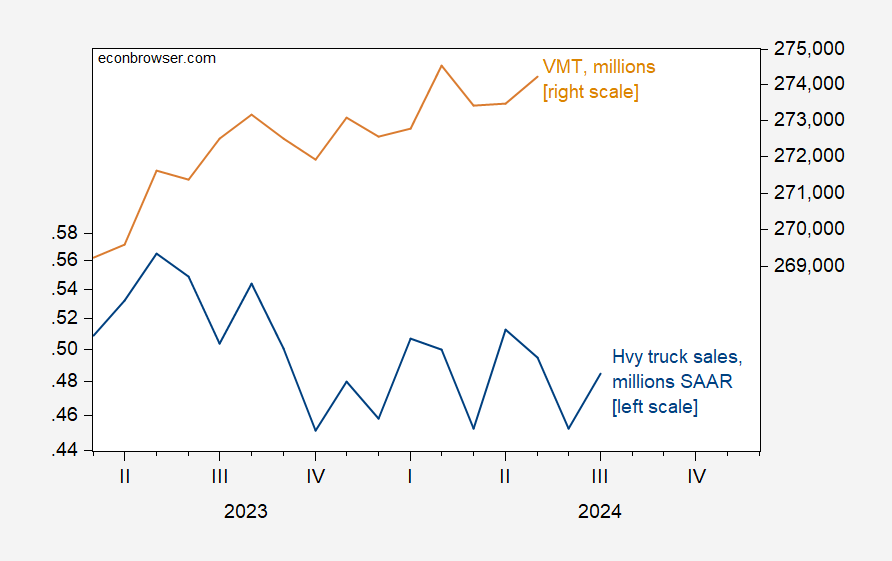
Figure 3: Heavy truck sales, in millions SAAR (blue, left scale), and vehicle miles traveled, in millions, s.a. (tan, right scale). Source: Census, NHTSA via FRED.
Higher frequency (weekly) indicators:
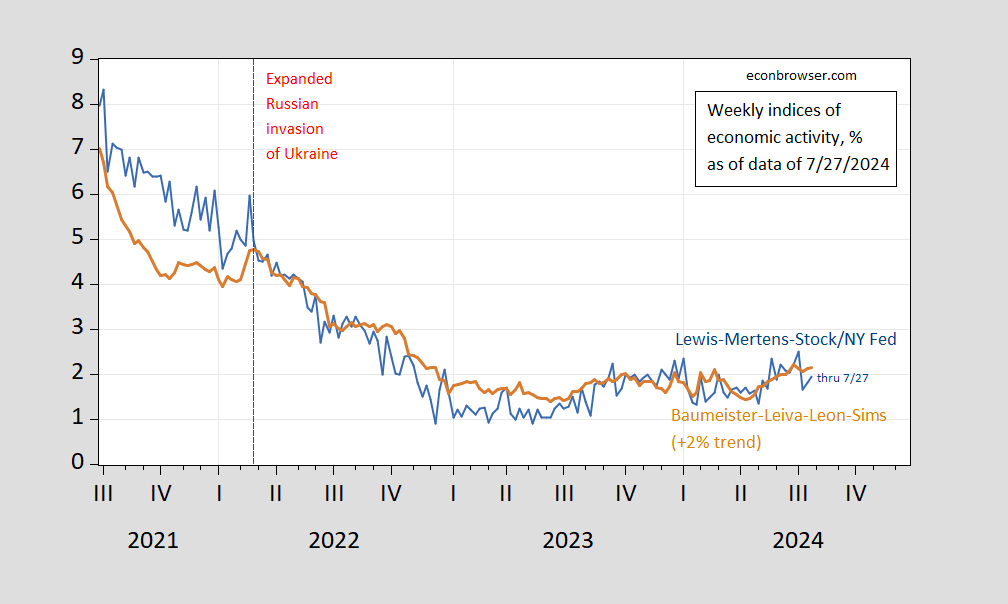
Figure 4: WEI (blue), WECI plus 2% (tan), in %. Source: NY Fed via FRED, Baumeister et al.
For a longer term perspective, across macro aggregates:
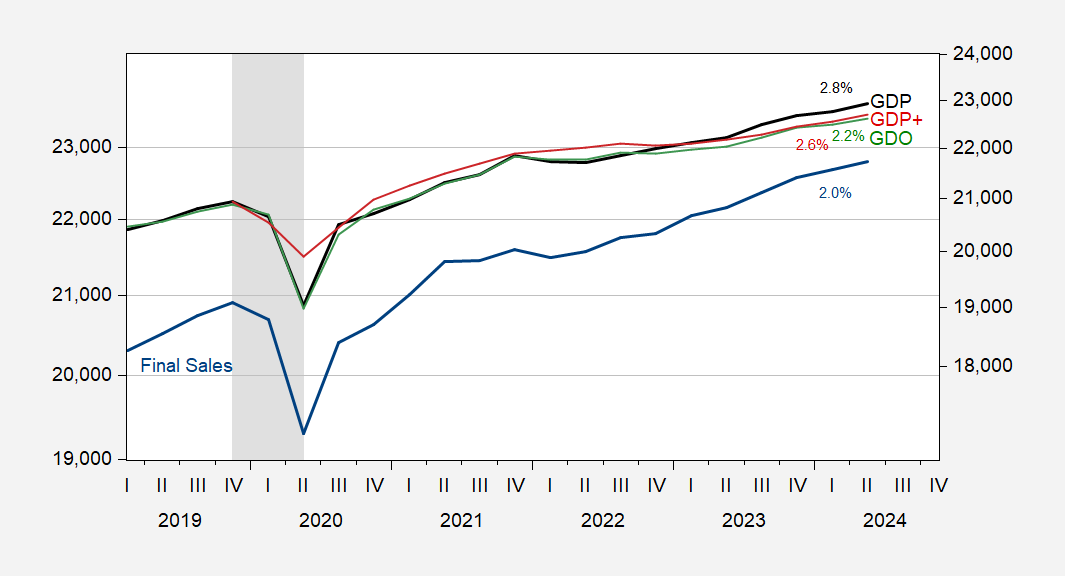
Figure 5: GDP (bold black, right scale), GDO (green, right scale), GDP+ (red, right scale), final sales (blue, left scale), all in bn.Ch.2017$ SAAR. GDP+ iterated on 2019Q4 GDP. GDI used in GDO estimated by author. NBER defined peak-to-trough recession dates shaded gray. Source: BEA, Philadelphia Fed, NBER, and author’s calculations.
Even if one thinks GDP is overestimating output, GDP+ is plugging along at 2.6% AR. Final sales, a proxy for aggregate demand, is growing at 2%. As of today, GDPNow nowcast for Q3 stands at 2.9% SAAR.
More By This Author:
Fed Funds Path As Of Noon ETWho Better Predicted The Transitory Inflation Surge Of 2021-24?
An Eventful Week – Interest Rates


Comments
Log in or sign up to join the conversation.