Real Final Sales And Inventories As Portents Of Recession
As I have mentioned previously from time to time, I read people who have interesting things to say even if their worldview is very different from mine. One such person is Mike Shedlock, a/k/a Mish. He’s an aggressive libertarian and has a long track record as a Doomer, but he frequently parses some thought-provoking economic data. It makes me think, even if I ultimately disagree, and that’s a good thing.
As you might imagine, for the past year he’s been talking about an ongoing recession. Not so noteworthy. But about a week ago he parsed Q4 GDP and pointed out that, when you take out inventories, real final sales and in particular real final sales to domestic purchasers looked extremely close to recessionary levels.
So I took a look, and here’s what I found.
First of all, here are real final sales (red) and real final sales to domestic purchasers (blue) for the last 8 quarters, both normed to 0 as of their Q4 2022 readings for ease of comparison:
(Click on image to enlarge)

Not exactly scintillating, but not negative either.
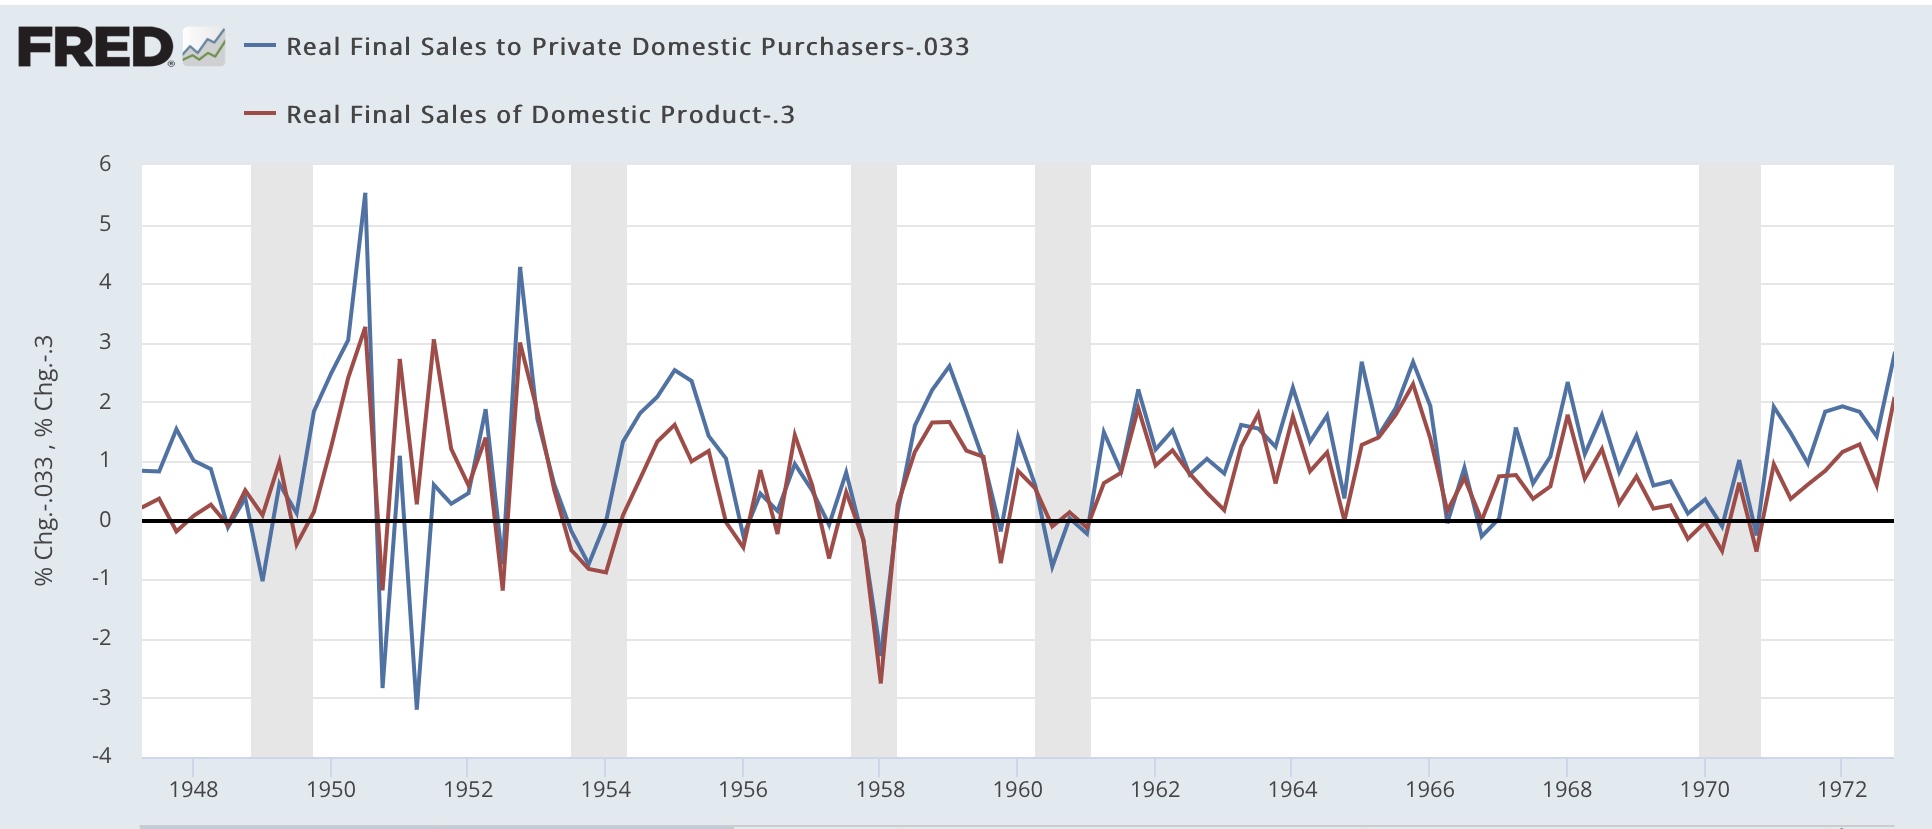
Now let’s look at the historical record, going all the way back to their start in 1947. Below I split up the series into 3 equivalent time periods, omitting 2020 (so that they’re not just squiggles) and, as with the graph above, normed both series to 0 as of their Q4 2022 readings:
(Click on image to enlarge)


There are lots of false positives (i.e., recession signals) if we rely on just one of the two series being as low Q/Q as they were in Q4 2022. But if we sort out when *both* were at readings that low, we get a much more interesting signal.
In *every* recession (of the 12 since the end of WW2), there was at least one quarter where both readings were as low or lower as they were in Q4 2022. Further, frequently they both turned negative 1-3 quarters before a recession began. If we take those out, there are only 5 false positives, and 3 of those are in the late 1940s and 1950s. In the past 60 years, there have been only 2 false positives, in 1966 and 1987, which were deep slowdowns that didn’t quite turn into recessions.
So the deep slowdown in real final sales and real final sales to domestic purchasers in Q4 is telling us that the economy was by no means out of the woods.
One important difference over the years is how quickly producers responded to changes in demand by increasing or liquidating inventory. Before 1992, there was a consistent and demonstrable lag:
(Click on image to enlarge)

In other words, suppliers continued to build up inventory for a quarter or more after sales turned down. To eliminate this build-up, they cut production and also the workers on the production line.
Since 1992, with the “just in time” inventory model, frequently with overseas suppliers, inventory liquidation has happened more quickly and with a far less severe impact on sales:
(Click on image to enlarge)

Given the problems with the “just in time” model exposed by the pandemic, producers may be reverting to a more conservative “just in case” model, which will require steeper inventory reductions again.
Before the first estimate of Q1 2023 GDP at the end of April, we’ll get January and February business sales and inventories, which will give us some information as to what is happening with inventories, and whether the Q4 weakness in real final sales was indeed a portent of recession.
More By This Author:
Jobless Claims: The Situation Remains, ‘All System Go’February Manufacturing And January Construction Continue Negative, While Auto Sales Improve
Housing Prices Continue To Come Down - Like A Feather
Disclaimer: This blog contains opinions and observations. It is not professional advice in any way, shape or form and should not be construed that way. In other words, buyer beware.


