Private Employment Under Obama And Bush
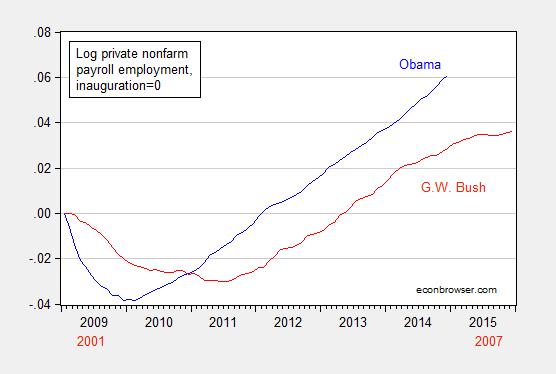
Reader Move On admonishes me to … move on. So here is job creation in this Administration, in comparative perspective.

Figure 1: Log private nonfarm private employment normalized to 2009M01 (blue), and to 2001M01 (red).
Source: BLS, and author’s calculations.
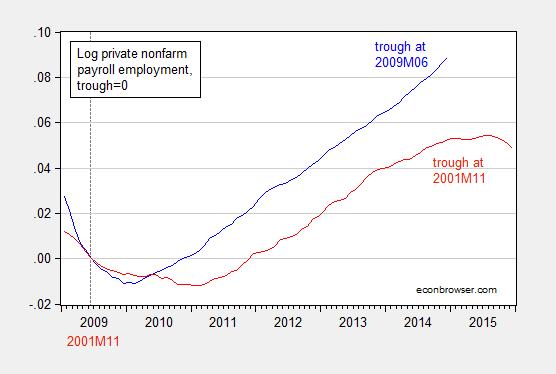
Figure 2 presents private employment normalized on the relevant troughs (as defined by the NBER).

Figure 2: Log private nonfarm private employment normalized to 2009M06 (blue), and to 2001M11 (red).
Source: BLS, NBER, and author’s calculations.
The astute observer will note the deceleration in employment growth as one moves toward the end of the G.W. Bush Administration. In fact, private employment was 462,000 less at the end of the G.W. Bush administration than at the beginning, i.e., -0.4% lower (in log terms).
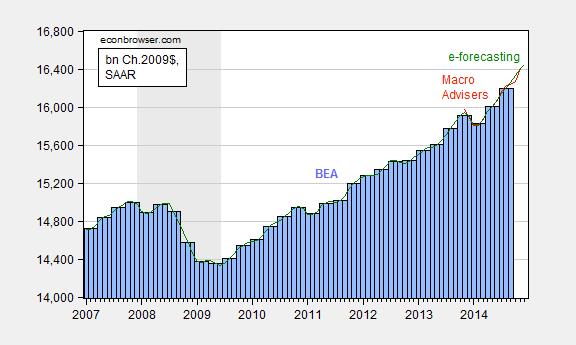
On a related matter, Macroeconomic Advisers and e-forecasting have reported monthly GDP for November and December, respectively. For now, output seems to continue to rise at a fairly rapid clip.

Figure 3: GDP, in billions Ch.2009$, SAAR (blue bars), monthly GDP from Macroeconomic Advisers (red), and e-forecasting (green). NBER defined recession dates shaded gray.
Source: BEA 2014Q3 final release, Macroeconomic Advisers (15 Jan.), and e-forecasting (21 Jan.).
Disclosure: None.


