
Prices At The Pump Following The Seasonal Script
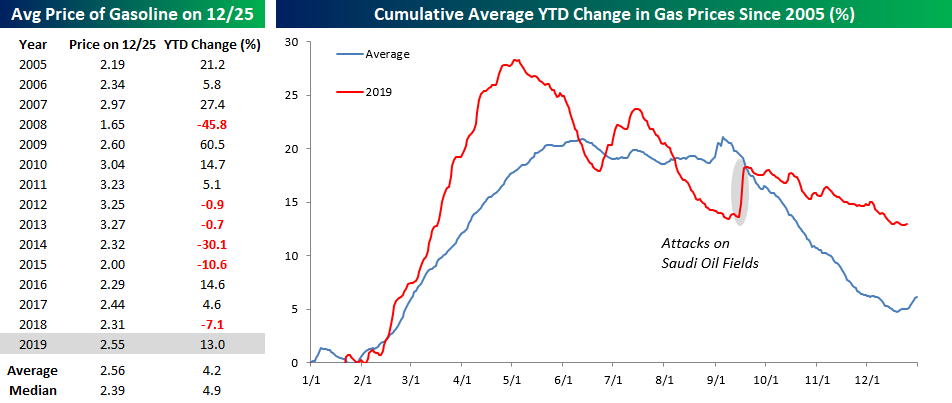
For many Americans, gas prices are a big part of the annual budget, and while this year saw an above-average increase in prices at the pump, the actual price levels are right in line with their historical average. The table below shows the average price level and YTD percent change in gas prices over each of the last 15 years. At a level of $2.55 per gallon, the national average price of gasoline is a penny less than the historical average going back to 2005 and 16 cents above the median level of $2.39. In terms of the YTD change, though, this year’s gain of 13% is triple the 4.2% average for all years.
The chart to the right of the table compares the change in gas prices this year to a composite of the historical average dating back to 2005. For the most part, this year’s path of prices followed the historical trend. The key difference, though, is that prices in the Spring this year saw a much larger than average increase. Once prices peaked in April, they started to decline at a faster than average pace and were actually up less than average by late summer. Following the attacks on the Saudi oil fields in September, though, the YTD change moved back above the historical average and has stayed there ever since.
(Click on image to enlarge)
The chart below shows the y/y change in gas prices since 2006. With a 10.4% increase compared to this time last year, the y/y change is currently the highest since late 2018, although by historical standards the current level is nowhere near an extreme.
(Click on image to enlarge)

Disclaimer: To begin receiving both our technical and fundamental analysis of the natural gas market on a daily basis, and view our various models breaking down weather by natural gas demand ...
more

