
Josh Hendrickson argues that an ideal price index should include asset prices. I am not going to address that issue, as I’m not sure what an ideal price index is. But it’s a good post—worth reading if you are interested in price indices.
Instead, I’d like to focus on a less controversial claim in the Hendrickson post:
From that description, one can easily understand why I called that “ideal.” How would one go about finding changes in the cost of a constant-utility basket of goods when utility isn’t really observable?
A practical solution to estimating a price index might be as follows. Consider two-period, two-good example. We observe the price of eggs and the price of milk each period. We also observe the quantity of eggs purchased and the quantity of milk purchased each period. If we want to track changes in prices over time, we could calculate expenditures for period 1 and period 2 using the quantities of eggs and milk purchased in the first period. Alternatively, we could calculate expenditures for period 1 and 2 using the quantities of eggs and milk purchased in the second period. In each case, the first period’s expenditure could be normalized to 100 and the second period price level could be calculated by multiplying 100 by the ratio of expenditures in period 2 to expenditures in period 1. Or, if we want to get really fancy, we could take the geometric average of the ratio of expenditures using both methods and multiply that by 100 to get the price level in the second period.
The purpose of doing any of these three options is that, since you are holding quantities constant across periods, your measures of expenditures are only capturing changes in prices. Effectively, what you are doing is constructing a weighted average of prices in which the weights are fixed quantities of the goods.
This is all pretty standard, similar to what you might find in an economics textbook. But this discussion implicitly assumes an equivalence between fixed quantities and fixed utilities. I will argue that this assumption is not justified, and then use my analysis to explain problems with the Michigan survey of inflation expectations.
To make things as simple as possible, imagine an economy with only one good and no quality changes over time. According to our textbooks, it should be easy to measure the rate of inflation in that sort of economy. But even in that case the inflation rate will differ depending on whether you assume constant utility or constant quantity.
Imagine an economy where the aggregate quantity of the only good increases at 5% per year, while the price of that good rises by 10%/year. You can think of that economy as having a 15% nominal growth rate. (I’ll ignore compounding for simplicity; technically it’s 15.5%). How much extra income would a person need each year in order to maintain a constant utility? I’m not sure, but I’m pretty confident the answer is not 10%, and it’s also not 15%.
1. A person that got a 15% raise would be able to buy 5% more real goods. So presumably their utility would be higher than before.
2. A person that got a 10% raise would be able to buy the same amount of goods, while that person’s acquaintances would be 5% ahead in real terms. So presumably that person would feel worse off in terms of utility.
This suggests that a measure of inflation that holds utility constant would be somewhere between 10% and 15%. You can think of utility as being a function of both absolute quantity of consumption and consumption relative to other people. Furthermore, it would vary by individual. A loner with no friends might be satisfied with a 10% raise, while a person that acutely feels any sort of “unfairness” in life might need almost 15% more income to maintain a constant utility. In other words, there’s a different ideal price index for each person.
Let’s assume that instead of holding utility constant, we hold quantity constant. Then it becomes easy to calculate inflation—which would be exactly 10% in this case. Unfortunately, our textbooks seem to conflate “constant quantity” and “constant utility” in a way that ignores the social aspect of consumption.
My thought experiment involves an economy where quantity grows over time. But the same problem occurs with quality improvements. Here again, a “hedonic” adjustment that attempts to account for quality changes will typically come up with a lower estimate of inflation than an index that holds utility constant. Thus the BLS says that the price of TVs has fallen by more than 99% since 1959 (due to quality improvements), but average people don’t think that way. They want to know how much more it costs to buy the sort of TV their neighbors have, not how much more it costs to buy the sort of TV their grandparents had.
Notice that the Michigan survey of 12-month inflation expectations generally hovers close to 3% from 2000 to 2020, even as measured inflation averaged a bit under 2%. Economists might be inclined to write off the public’s estimate as being “biased”, or “uninformed”. The public doesn’t understand about substitution bias, or quality changes.
(Click on image to enlarge)
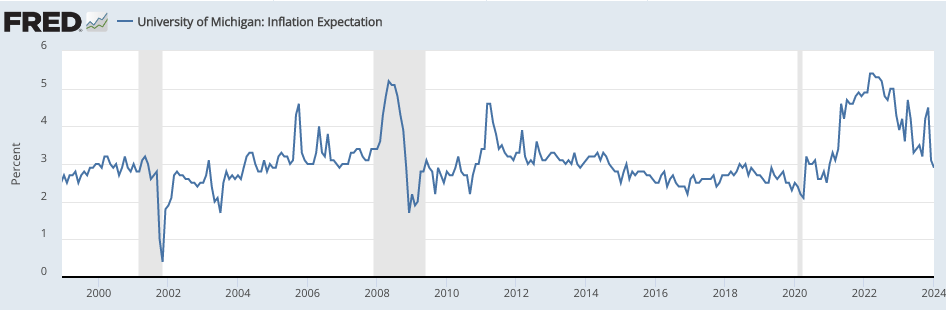
Or perhaps the public is taking seriously the “constant utility” definition of inflation. Perhaps they are saying they need about 3% more income to maintain their utility at a constant level. Notice that the public’s estimate of inflation is slightly below the average rise in per capita nominal incom
More By This Author:
Does Taxing Capital Encourage Capital Formation?The Decline Of Economics
Powell Is Wrong About Inflation


Comments
Log in or sign up to join the conversation.